Article Text

Abstract
Objective: To determine the pattern of the abnormal ventilatory response in heart failure and how it relates to symptoms by looking at tidal volume (Vt) and frequency (f) during exercise.
Methods: 45 patients with heart failure and 21 controls underwent maximal treadmill based exercise testing with metabolic gas exchange analysis. The relation of ventilation (V̇E) to Vt was plotted to look for an inflection point where Vt failed to increase further. The slope of the relation before this inflection point was documented. Time to the inflection point, Vt, and f at the inflection point were recorded. The relation of symptom scores to f and V̇E was also examined.
Results: Peak oxygen consumption (PV̇o2) (mean (SD)) was lower (19.7 (4.5) v 37.9 (8.6) ml/kg/min; p < 0001) and the ventilation to carbon dioxide production (V̇E/V̇co2) slope was steeper (40.0 (6.5) v 26.0 (1.6); p < 0.0001) in patients with heart failure than in the control group. The patients reached the inflection point of the V̇E/Vt slope sooner during exercise than the controls (271 (110) v 502 (196) seconds; p < 0.0001). Patients had a higher f and a smaller Vt at that point and throughout exercise until the peak where f was the same for patients and controls. Vt at the inflection point correlated with PV̇o2 (r = 0.67; p < 0.0001). Despite having an increased sensation of breathlessness for a given V̇E, patients were less symptomatic of f than controls.
Conclusions: Patients with heart failure breathe at a higher f throughout exercise, reaching an apparent maximal Vt earlier. The Vt at an inflection point on the V̇E/Vt slope predicts PV̇o2.
- chronic heart failure
- ventilation
- frequency
- breathlessness
- f, frequency of ventilation
- FEV1, forced expiratory volume in one second
- PV̇o2, peak oxygen consumption
- NYHA, New York Heart Association
- V̇co2, carbon dioxide production
- V̇E, minute ventilation
- V̇eqco2, ventilatory equivalent of carbon dioxide
- Vt
- tidal volume
Statistics from Altmetric.com
- f, frequency of ventilation
- FEV1, forced expiratory volume in one second
- PV̇o2, peak oxygen consumption
- NYHA, New York Heart Association
- V̇co2, carbon dioxide production
- V̇E, minute ventilation
- V̇eqco2, ventilatory equivalent of carbon dioxide
- Vt
- tidal volume
The dominant symptom of patients with treated chronic heart failure is exercise intolerance, usually caused by breathlessness and fatigue. This can be assessed objectively by incremental exercise testing with metabolic gas exchange measurements to derive peak oxygen consumption (PV̇o2) as an index of exercise capacity.1 At the same time, the slope of the relation between ventilation and carbon dioxide production (V̇E/V̇co2 slope) can be used to characterise the ventilatory response to exercise.2,3 Typically in chronic heart failure, PV̇o2 is reduced and the V̇E/V̇co2 slope is increased.4,5 Thus, for a given V̇co2, the ventilatory response (V̇E) is greater. PV̇o2 and V̇E/V̇co2 vary inversely and both are related to symptom scores and prognosis.6,7
V̇E is the product of tidal volume (Vt) and breathing frequency (f), and a varying combination of the two variables can generate an increase in V̇E during exercise. Previous investigators have suggested that there is an increase in f for a given Vt.8 This has the potential effect of increasing dead space ventilation; at a given V̇E, if f is increased and therefore Vt is reduced, then fixed anatomical dead space is ventilated more often and forms a higher proportion of V̇E. Yokohama and colleagues9 previously reported that f starts to increase relative to Vt simultaneously with the perception of breathlessness, although this has not been replicated.10
We wished to characterise more closely the ventilatory response to exercise looking particularly at the relation of f and Vt to total minute ventilation and V̇co2 and their relation to exercise capacity and the perception of breathlessness.
PATIENTS AND METHODS
We examined the responses to exercise of 45 consecutive patients with chronic heart failure and 21 controls. The control group consisted of age matched subjects chosen at random from the lists of local general practitioners. The study was approved by the local ethics committee.
Chronic heart failure was defined as the presence of symptoms of fatigue or breathlessness on exertion and a left ventricular ejection fraction on echocardiography of < 40% with no other apparent cause of breathlessness. The condition had to be of at least three months’ duration with no recent exacerbation or change in medication. Patients with evidence of symptomatic chest disease, neurological conditions, or inducible ischaemia were excluded from the analysis. We also excluded patients and controls with a forced expiratory volume in one second (FEV1) of < 75% of the predicted volume. None of the control subjects was taking regular medication and all underwent echocardiography to exclude left ventricular dysfunction.
Each subject underwent symptom limited treadmill based maximal exercise testing using a Bruce protocol modified by the addition of a “stage 0” at onset consisting of three minutes of exercise at 1.61 km/hour (1 mile/hour) with a 5% gradient. Participants were encouraged to exercise to exhaustion. During the tests patients wore a tightly fitting face mask to which was connected a capnograph and a sample tube enabling online measurement of ventilation and metabolic gas exchange (Oxycon Delta system, Jaeger, Hoechberg, Germany). A respiratory exchange ratio (V̇co2/V̇o2) > 1 was taken to suggest a maximal effort. Spirometry (FEV1 and forced vital capacity) was performed before the exercise test. At the end of each stage and at peak exercise subjects were asked to indicate their score for dyspnoea or fatigue on a scale from 0 (no symptoms) to 10 (maximal symptoms) using a standardised scoring system.11 The anaerobic threshold was calculated by the V slope method.12
To allow construction of a slope relating symptom scores to total ventilation, we included only patients who managed at least the first stage (stage 0) of the protocol outlined above.
We plotted Vt against f (Vt/f slope) and Vt against V̇E (V̇E/Vt slope) for exercise in all subjects. Any inflection point on each slope was identified by a single reporter (KW), and V̇E, Vt, f, oxygen consumption, and the ventilatory equivalent of carbon dioxide (V̇eqco2) at that point were documented. Specifically, the inflection point on the slope relating V̇E to Vt was identified by plotting a simple regression slope at the proximal results (early exercise) and one for the later stages of exercise similar to the V slope method for the identification of the anaerobic threshold.12 The average Borg score, V̇E, and f at the end of each stage for controls and patients were plotted against each other to derive slopes for V̇E/Borg and f/Borg relations. The V̇E/Borg slope was also calculated for each person. These individual data were compared using unpaired Student’s t test. The reporter was blinded as to the identity of the subjects and whether they were patients or controls. V̇eqco2 was recorded at rest, at the anaerobic threshold, and at peak exercise. Maximum voluntary ventilation was calculated as 35 × FEV1.13
Results are reported as mean (SD). We used an unpaired Student’s t test for between group comparisons. A probability value of p < 0.05 was taken to suggest that the observed differences between the control population and the patients were significant. We performed linear regression analysis to explore the relation between variables.
RESULTS
Table 1⇓ shows characteristics of the study groups. All patients but one were taking angiotensin converting enzyme inhibitors or angiotensin II inhibitors, and 15 were taking β blockers. PV̇o2, anaerobic threshold, and exercise time were greater in the controls than in the patients. The respiratory exchange ratio at peak exercise was the same in both groups suggesting similar levels of exertion. The V̇E/V̇co2 slope was steeper in the patients than in the controls. At peak exercise f was not significantly different between the two groups. However, total minute ventilation was significantly less in the patients because of a lower Vt (1.8 (0.4) v 2.6 (0.6); p < 0.0001) (table 2⇓). V̇eqco2 and the ventilatory equivalent for oxygen were also significantly higher at peak in the patients.
Subject characteristics
Variables at peak exercise
Although patients with specific lung pathology or reduced lung function were excluded from the analysis, both forced vital capacity and FEV1 were reduced in patients (table 1⇑).
We could describe an inflection point in the Vt/f relation in only six patients and seven control subjects (fig 1⇓). However, in all subjects an inflection point was identified in the V̇E/Vt relation at which Vt no longer increased significantly with the slope becoming almost perpendicular to the x axis (fig 2⇓). Total ventilation at this point was the same in patients and controls (44.6 (10.8) v 40.0 (14.5) l/min; p = 0.2), but f was greater (25.8 (5.8) v 20.7 (3.8) l/min; p = 0.0004) and Vt smaller in patients (1.6 (0.3) v 2.2 (0.6) l; p < 0.0001). Oxygen consumption at the inflection point was lower and the ventilatory equivalents for the metabolic gases were greater at the inflection point in the patients than in the controls, as was the Borg score (table 3⇓). The patients were also breathing at a greater percentage of their maximum voluntary ventilation capacity and at a greater proportion of peak ventilation at the inflection point.
Values at the inflection point

Relation of tidal volume (Vt) to frequency (f) during a peak exercise test in a typical control subject. No inflection point can be observed.

Relation of minute ventilation (V̇E) to tidal volume (Vt) during a peak exercise test in a typical patient (open circles) and a control subject (closed circles). An inflection point can be observed for both subjects.
The gradient of the V̇E/Vt slope before the inflection point was significantly steeper in patients than in controls (fig 2⇑) (21.6 (6.8) v 15.8 (4.1); p = 0.0007) so that at a given V̇E, Vt was smaller. This slope correlated with the V̇E/V̇co2 slope (r = −0.42; p = 0.0004). The patients reached the inflection point significantly sooner than did the controls (271 v 502 seconds; p < 0.0001). Vt at the inflection point predicted PV̇o2 (r = 0.67; p < 0.0001) (fig 3⇓). This relation remained significant within the patient group (r = 0.37; p < 0.001).

Relation between Vt at the inflection point and the peak oxygen consumption (V̇o2) at the inflection point for patients (open circles) and controls (closed circles).
Within the patient group, there were significant differences in the exercise variables between patients in New York Heart Association (NYHA) functional classes II and III (table 4⇓). The PV̇o2 was lower and the V̇E/V̇co2 slope steeper in those in class III. There were no significant differences in FEV1 and forced vital capacity between the classes, or in Vt, V̇E, and f at peak exercise. Patients in NYHA class III reached the inflection point significantly sooner than those in class II (p < 0.05). The ventilatory variables were otherwise not significantly different at the inflection point (table 4⇓).
Ventilatory variables in patients according to New York Heart Association (NYHA) functional class
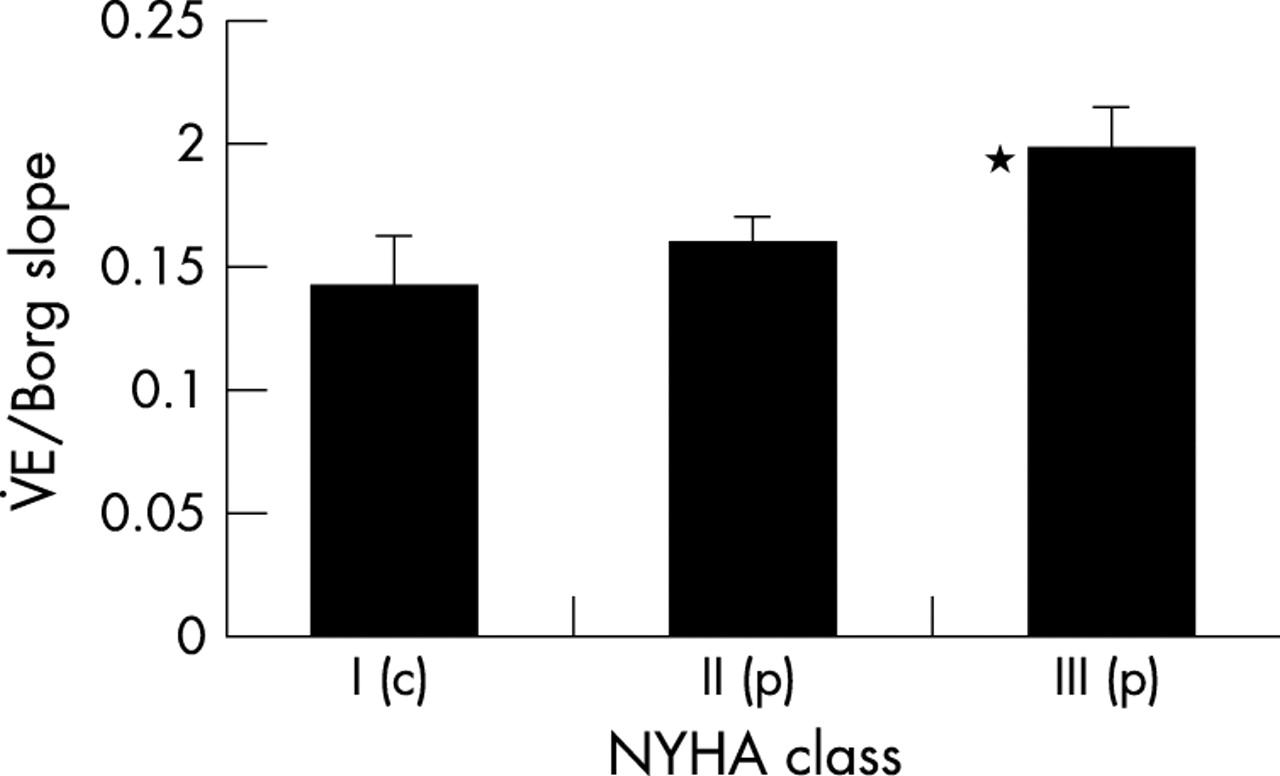
Patients were more symptomatic for a given level of ventilation from the outset of exercise shown by a steeper slope relating V̇E to Borg score (0.176 (0.04) v 0.123 (0.07); p = 0.001) (fig 4⇓). The Borg/V̇E slope correlated with PV̇o2 (r = 0.52; p < 0.0001). However, the slope relating Borg score to f was not greater in patients than controls (0.47 (0.03) v 0.45 (0.05); p = 0.4) but was shifted to the right (fig 5⇓). Patients in class III had significantly steeper Borg/V̇E slopes than those in class II (fig 6⇓).

Relation between the Borg score and averaged minute ventilation for each stage during a peak exercise test in patients (dashed line) and controls (solid line). The error bars represent standard deviations around the means.
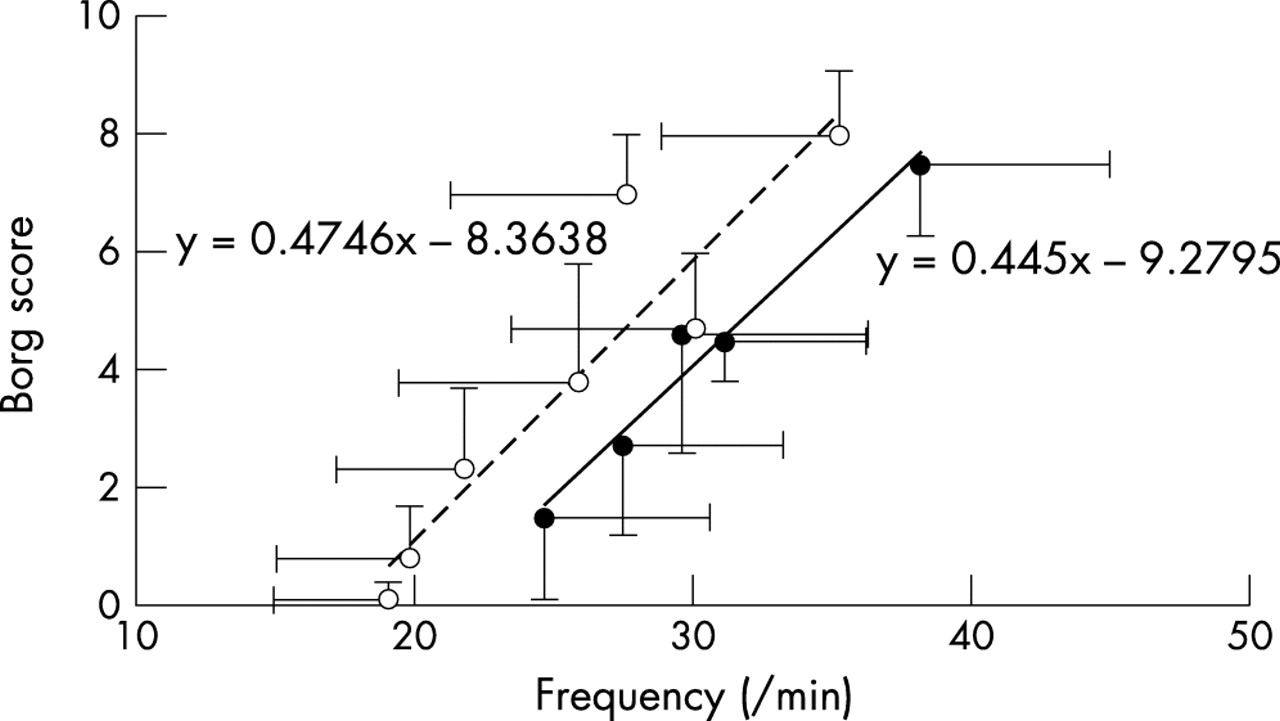
Relation between the Borg score and averaged f (standard deviations are shown) for patients (dashed line) and controls (solid line). The error bars represent the standard deviations around the means.
Mean V̇E/Borg slope according to New York Heart Association functional class (p, patient; c, control; *p < 0.05 between those in class II and class III). The error bars represent the standard deviation around the means.
DISCUSSION
V̇E increases during exercise. Total minute ventilation is the product of Vt and f, and during exercise both increase to generate a rise in V̇E. Any pair of lungs must, however, reach a limit of Vt past which further increases in V̇E depend on increases in f. This occurs in the later stages of exercise.
Patients with chronic heart failure ventilate more during exercise than controls,14 resulting in an increase in the V̇E/V̇co2 slope.4,5 Previous work has shown that patients breathe at a lower Vt and higher f throughout exercise.8 The reason for this remains unclear but may lead to an increase in the proportion of dead space ventilation. The increased V̇E/V̇co2 slope would be a consequence.8 However, the volume of dead space as a proportion of total ventilation is the same in patients and controls during exercise.15. The increased V̇E/V̇co2 slope must therefore be a result of other mechanisms. Ventilation perfusion mismatch,16–,18 impaired diffusion of metabolic gases,19 respiratory muscle weakness,20,21 and heightened sensitivity of peripheral receptors22–,24 have all been postulated as possible causes.
Yokoyama and colleagues9 reported a point on the Vt/f curve at which f started to increase relative to Vt and that it was at this point that symptom scores rose. Dimopoulou and colleagues25 also plotted the slope relating Vt to f in patients with chronic heart failure but were able to identify an inflection point on only 73%. Neither group reported data from controls. In our subjects we were unable to identify such a point reliably and therefore used the slope of Vt against V̇E to identify the contribution of each component to total ventilation. This showed a clear inflection point where f increases more rapidly and Vt fails to increase further, which may be unequivocally identified in all subjects. Before this, the Vt/V̇E slope is significantly steeper for patients than for controls. This implies that patients depend more on increases in f to mediate increases in V̇E than controls from the outset of exercise. Patients with heart failure have respiratory muscle weakness.20,21 Rapid shallow breathing has a lower energetic cost than deep breathing26 but is less efficient in terms of alveolar ventilation because of the relative increase in dead space ventilation. This breathing pattern may occur after inspiratory muscle fatigue to minimise respiratory sensation.27
Although f during exercise is greater in patients, at peak exercise f is the same for patients of both NYHA classes and controls despite significantly lower peak V̇E in the patients. As a consequence Vt at peak determines the maximum V̇E achieved.
Previous data have suggested that V̇E does not limit peak exercise in patients with heart failure.28,29 In the present study, however, Vt at an early point predicted PV̇o2. This influence of Vt on exercise capacity is important because it may partly explain the benefit from positive pressure ventilation,30 which may improve the depth of breathing and help in training programmes aimed at improving the control and depth of ventilation.31 Furthermore, recent work showing the presence of increased resistance to airflow and reduced lung compliance in patients with chronic heart failure confirms the importance of pulmonary function and the work of breathing on symptoms in chronic heart failure.32
The present study also showed that patients and controls ventilate at the same proportion of maximum voluntary ventilation at peak. As this measure is recorded at rest this suggests that the likely defect of ventilatory mechanics is present during rest and exercise. Several authors have found impaired inspiratory muscle strength33–,35 and endurance.36
We also observed that the patients were more symptomatic for a given level of ventilation and that this was related to their NYHA status. The slope relating f to Borg score was shifted to the right, giving a higher f for a given symptom score. The slope was, however, the same for patients and controls. This, and the fact that f is the same at peak in both groups, implies that f is not the cause of increased symptoms in patients with heart failure, as suggested by previous work.9 The present study actually suggests that patients are less symptomatic for a given f than are controls.
In conclusion, we have shown reduced Vt throughout exercise, that this is closely linked with exercise performance, and that ventilation is initially maintained by an increase in f, which may later in exercise contribute to fatigue of respiratory muscles. The present study also shows that Vt at an inflection point occurring early in exercise predicts PV̇o2. The cause of the impairment in Vt remains to be elucidated but it is possible that this “peak Vt” may be a method of assessing outcome in patients unable to perform a true peak exercise test. These abnormalities in the pattern of ventilation seem to worsen with increasing severity of heart failure. Patients are more symptomatic for a given ventilation but this seems not to be caused by the increased f.