Article Text

Abstract
Objective: To evaluate whether direct planimetry of aortic valve area (AVA) by cardiac magnetic resonance (CMR) imaging is a reliable tool for determining the severity of aortic stenosis compared with transthoracic echocardiography (TTE), transoesophageal echocardiography (TOE), and cardiac catheterisation.
Methods: 44 symptomatic patients with severe aortic stenosis were studied. By cardiac catheterisation AVA was calculated by the Gorlin equation. AVA was measured with CMR from steady state free precession (true fast imaging with steady state precession) by planimetry. AVA was also determined from TOE images by planimetry and from TTE images by the continuity equation.
Results: Bland-Altman analysis evaluating intraobserver and interobserver variability showed a very small bias for both (−0.016 and 0.019, respectively; n = 20). Bias and limits of agreement between CMR and TTE were 0.05 (−0.35, 0.44) cm2 (n = 37), between CMR and TOE 0.02 (−0.39, 0.42) cm2 (n = 32), and between CMR and cardiac catheterisation 0.09 (−0.30, 0.47) cm2 (n = 36). The sensitivity and specificity of CMR to detect AVA ⩽ 0.80 cm2 measured by cardiac catheterisation was 78% and 89%, of TOE 70% and 70%, and of TTE 74% and 67%, respectively.
Conclusion: CMR planimetry is highly reliable and reproducible. Further, CMR planimetry had the best sensitivity and specificity of all non-invasive methods for detecting severe aortic stenosis in comparison with cardiac catheterisation. Therefore, CMR planimetry of AVA with steady state free precession is a new powerful diagnostic tool, particularly for patients with uncertain or discrepant findings by other modalities.
- AVA, aortic valve area
- CMR, cardiac magnetic resonance
- SSFP, steady state free precession
- TOE, transoesophageal echocardiography
- TTE, transthoracic echocardiography
- cardiac magnetic resonance
- aortic stenosis
- valve area
Statistics from Altmetric.com
- AVA, aortic valve area
- CMR, cardiac magnetic resonance
- SSFP, steady state free precession
- TOE, transoesophageal echocardiography
- TTE, transthoracic echocardiography
Aortic stenosis is the most common valvar heart disease resulting in valve replacement.1 The indication for valve replacement depends on symptoms as well as functional and haemodynamic variables such as aortic valve area (AVA).2 Therefore, exact evaluation of the aortic valve and the AVA is necessary for treatment decision making. In the clinical routine, transthoracic echocardiography (TTE) with the continuity equation is most frequently applied for the non-invasive evaluation of AVA.3–5 However, in many cases the use of TTE is limited by poor acoustic windows and erroneous calculations caused by annulus calcification or eccentric jet morphology.3–9 Thus, invasive confirmation of echocardiographic measurements is still routinely used in many institutions before valve replacement surgery. For this purpose, semi-invasive AVA planimetry based on transoesophageal echocardiography (TOE) and invasive cardiac catheterisation evaluating AVA by applying the Gorlin formula are available. However, TOE is not well tolerated by most patients and direct planimetry by TOE is limited to patients presenting without heavy calcification or a poor acoustic window.10,11 Most catheterisation results are directly influenced by cardiac function or concomitant aortic regurgitation.12,13 In addition cardiac catheterisation is an invasive procedure that may be associated with life threatening complications.14 Therefore new strategies to evaluate and to follow the progression of aortic stenosis are needed.
In the present study we investigated cardiac magnetic resonance (CMR) imaging with steady state free precession (SSFP) CMR as a non-invasive approach for direct AVA planimetry. In contrast to older gradient echo based imaging protocols, SSFP is widely independent of haemodynamic status, flow turbulence, and valvar calcification.15–21 The goal of this study was to evaluate direct CMR planimetry of the AVA as a possible new reliable method for clinical decision making regarding aortic valve replacement by comparing CMR results with results of echocardiography and cardiac catheterisation.
METHODS
Patients
We enrolled 44 consecutive patients in our study after they gave informed consent to the protocol. All patients had known aortic stenosis defined by echocardiography and were admitted to the Robert Bosch Medical Centre, Stuttgart for treatment decision making regarding aortic valve replacement. The majority of patients presented with clinical symptoms of severe aortic stenosis, such as systolic murmur, dyspnoea on exertion, syncope or dizziness, chest pain, or history of cardiac failure. Table 1 shows the baseline clinical parameters. Concomitant aortic regurgitation was present in 23 patients and was defined as mild (n = 18) or moderate (n = 5) by CMR and echocardiography. Patients underwent CMR imaging an average (SD) of 10 (8) days after TTE, 5 (5) days after TOE, and 7 (5) days after catheterisation. All diagnostic procedures and measurements were performed by experienced observers, who were blinded to the results of the other imaging modalities.
Patient characteristics
CMR imaging
CMR imaging was ECG gated and with SSFP pulse sequences (true fast imaging with steady state precession; echo time 1.58 ms, repetition time 47.4 ms, flip angle 60°, and voxel size 1.8 × 1.3 × 5 mm at a field of view of 340 mm) implemented on a 1.5 T Magnetom Sonata (Siemens Medical Systems, Erlangen, Germany). All images were acquired during repeated breath holds. For planimetry of the AVA two views of the left ventricular outflow tract were obtained: an oblique transverse plane of the left ventricular outflow tract and an oblique coronal plane, acquired orthogonally to the outflow tract of the transverse view. Next, imaging planes for planimetry were laid out perpendicular to the aortic annulus in both series (fig 1) starting at the tips of the valvar leaflets during cardiac systole. To avoid assessing AVA beyond or above the leaflet tips, both of which would have resulted in overestimation of the AVA, the imaging plane was moved up and down off-centre shiftwise in 2 mm steps for at least 4 mm in each direction (fig 2). Lastly, manual planimetry of the maximum visible AVA in systole was obtained two times in each series and values were averaged. The smallest maximum visible AVA of all measurements was used in this study. For planimetry areas of signal void caused by severe calcification, which were often found at the edges of the leaflets, were counted as part of the leaflet. For evaluation of interobserver variability, an additional observer performed the planimetry in 20 randomly selected patients. For assessment of intraobserver variability, the initial observers repeated the measurements in 20 randomly selected patients at least four weeks after the initial analysis.

(Left) Oblique transversal long axis view of the left ventricular outflow tract and (middle) oblique coronal basal short axis including the left ventricular outflow tract acquired perpendicular to the transversal long axis. Slice position for planimetry image planes are indicated by the white lines. (Right) Cross section of a tricuspid aortic valve in early systole of the same patient. The aortic valve area is visible as a high signal area (bright), indicating high blood flow velocity. With steady state free precession there is nearly no signal void due to calcification. Ao, ascending aorta; LA, left atrium; LV, left ventricle; RA, right atrium; RV, right ventricle.

To avoid assessing the aortic valve area (AVA) beyond or above the leaflet tips, both of which would result in overestimation of the AVA, the imaging plane was moved up and down off-centre shiftwise in 2 mm steps for at least 4 mm in each direction. In this patient (patient 10) an AVA of 0.71 cm2 as marked by a black box was evaluated and used for comparison.
Cardiac catheterisation
Cardiac catheterisation was performed by the standard femoral approach as reported previously.22 Left ventricular function was determined from biplane angiography. Left ventricular pressure measurements were obtained after retrograde placement of the catheters. Transvalvar pressure gradients were acquired by catheter pullback. Cardiac output was calculated according to the Fick principle, which then was used to determine AVA by applying the Gorlin equation.23
Transthoracic echocardiography
All patients were evaluated by two dimensional echocardiography and continuous wave Doppler with a 2.5 MHz transducer connected to a Vivid FiVe Echosystem (GE Medical Systems). To assess the maximum velocity of forward flow across the aortic valve, continuous wave Doppler measurements were done in multiple transducer positions (apical, right parasternal, and suprasternal). To minimise sampling artefacts, the three highest velocity signals were averaged to calculate peak and mean gradients. The left ventricular outflow tract diameter was evaluated by two dimensional imaging from the parasternal long axis and left ventricular outflow tract. The outflow tract velocity was recorded by pulsed Doppler measurements acquired from the apical five chamber view (fig 3, left panel). Lastly, AVA was calculated by the continuity equation.4
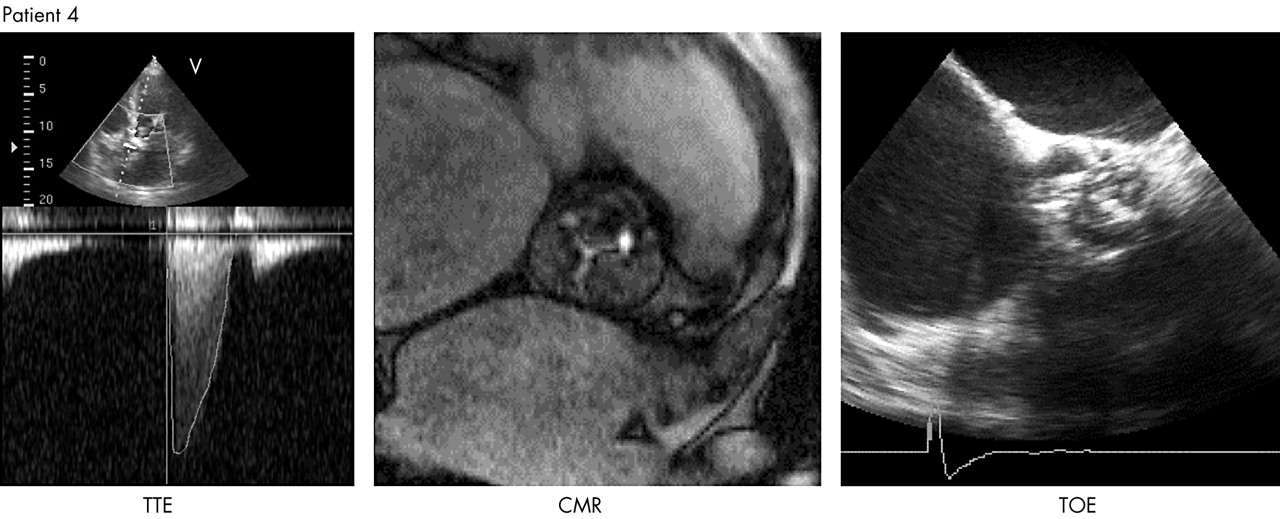
(Middle) An example of the excellent capabilities of cardiac magnetic resonance (CMR) imaging to evaluate aortic valves. (Right) The valve in this example could not be assessed by transoesophageal echocardiography (TOE) since it was not possible to define all commissural areas due to calcification. (Left) Applying the continuity equation based on transthoracic echocardiographic (TTE) assessments was also limited in this case due to a poor acoustic window and calcified deposits in the outflow tract annulus.
Transoesophageal echocardiography
We used a 5 MHz multiplane probe connected to a Vivid FiVe Echosystem (GE Medical Systems) for TOE imaging. After placing the probe to visualise the standard TOE long axis view of the aortic valve and the ascending aorta, we rotated the image plane from 0° to 180° yielding the best short axis image of the aortic valve opening. The smallest orifice during maximum opening in systole was measured on a magnified image in zoom mode. Planimetry was repeated two times and values were averaged accordingly. Patients in whom clear identification of commissural areas was not possible because of calcification were excluded from analysis. Figure 3 (right panel) shows a typical example of such a calcified valve.
Statistical analysis
Continuous data are expressed as mean (SD). Agreement between the four modalities (CMR, TTE, TOE, and cardiac catheterisation) was analysed by the “agreement using repeated measurements” method of Bland-Altman.24 Bias and 95% confidence intervals were calculated as described by Bland-Altman.24 For calculation of sensitivity and specificity to detect severe aortic stenosis (defined as AVA ⩽ 0.8 cm2) AVA assessed by cardiac catheterisation were chosen as the ideal as recommended by Braunwald and colleagues.25
RESULTS
Feasibility of CMR
Figure 4 shows CMR images of a typical patient. In four patients CMR imaging was not possible because of the presence of metallic implants (n = 2) or severe claustrophobia (n = 2). In five patients, the aortic valve could not be crossed by a catheter and the evaluation was completed by the transseptal approach. TOE planimetry of AVA was not possible in nine patients because of heavy calcifications. In three patients AVA could not be assessed by TTE because of a poor acoustic window. Based on these data, overall feasibility for CMR was 91% compared with 89% for cardiac catheterisation, 80% for TOE, and 93% for TTE. Table 1 details the characteristics of the patient population.

Typical steady state free precession (SSFP) CMR images visualising (top) left ventricular morphology (short axis) and (bottom) the left ventricular outflow tract and the aortic valve in patient 15.
CMR planimetry of AVA
Planimetry of AVA was possible in all patients undergoing CMR, including patients presenting with severe calcification, in whom planimetry was reported to be more difficult by all observers. Figure 3 (middle panel) shows a typical example of a calcified aortic valve. Despite a more difficult planimetry our analysis did not show any difference (table 2) between the intraobserver and interobserver variabilities of all highly calcified valves (n = 8) and less calcified valves (n = 12). Moreover, variability did not differ between patients with isolated aortic stenosis (n = 12) and patients with combined (stenosis and regurgitation) aortic lesions (n = 8) or between normal cardiac output (defined as left ventricular ejection fraction > 50%; n = 13) and low output (defined as LVEF < 50%, n = 7) (table 2).
Independence of measurements from clinical parameters
Comparing CMR with other methods
Table 3 shows the results of AVA measurements obtained by the each method. All techniques had similar means and standard deviations. Figure 5 displays the results of Bland-Altman analysis evaluating CMR intraobserver (fig 5A) and interobserver (fig 5B) variability, showing a very small bias for both. Almost all measured values were within the limits of agreement, indicating a good reproducibility of AVA planimetry with CMR.
Comparison of methods of planimetry of aortic valve area

(A) Intraobserver and (B) interobserver variability of AVA measured by CMR. According to Bland and Altman, the difference between the two comparative measurements (Meas1 and Meas2 for intraobserver variability and Obser1 and Obser2 for interobserver variability) is plotted against their mean. The continuous line represents the mean difference and dashed lines represent limits of agreement (mean difference (2SD).
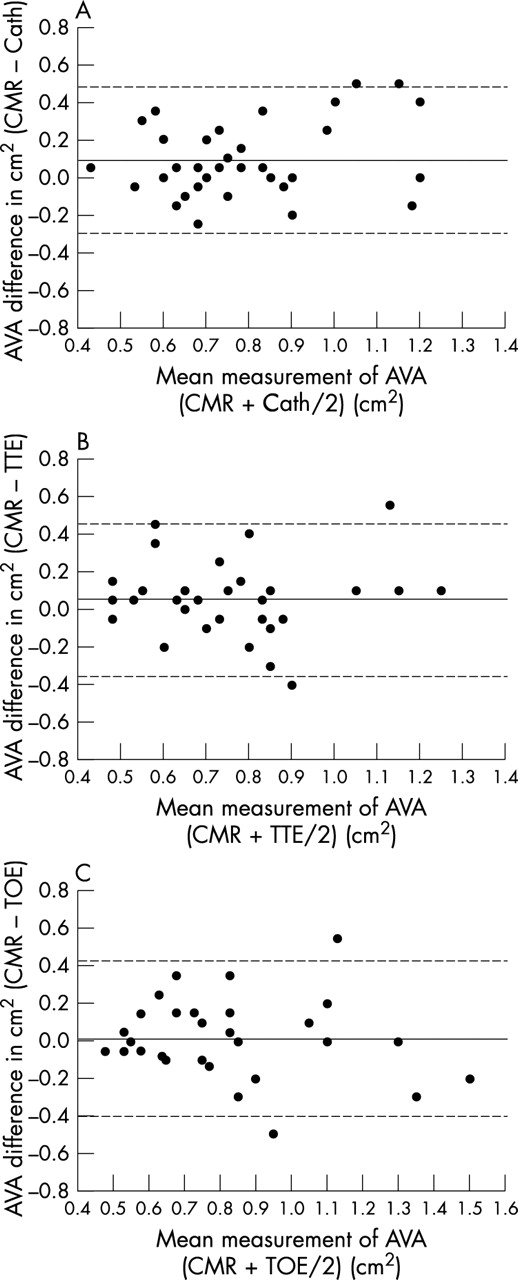
Figure 6 visualises the agreement of AVAs obtained by CMR versus cardiac catheterisation (fig 6A), CMR versus TTE (fig 6B), and CMR versus TOE (fig 6C). Mean differences and limits of agreement were 0.09 (−0.30, 0.47) cm2 for CMR versus cardiac catheterisation, 0.05 (−0.35, 0.44) cm2 for CMR versus TTE, and 0.02 (−0.39, 0.42) cm2 for CMR versus TOE. Mean differences and limits of agreement were 0.01 (−0.34, 0.36) cm2 for TOE versus TTE, −0.05 (−0.57, 0.47) cm2 for cardiac catheterisation versus TOE, and −0.03 (−0.52, 0.46) cm2 for cardiac catheterisation versus TTE. Thus, the extent of agreement between CMR and echocardiography or CMR or cardiac catheterisation was very similar to the extent of agreement between TOE and TTE or the extent of agreement between all the echocardiographic methods and cardiac catheterisation. However, CMR and TOE are likely to overestimate AVA in comparison with cardiac catheterisation and TTE by a mean difference of 0.05 to 0.09 cm2. Table 3 shows the complete results of our analysis.

Agreement between AVA assessed by (A) cardiac catheterisation (Cath), (B) TTE, and (C) TOE. According to Bland and Altman, the difference between the two comparative measurements is plotted against their mean. The continuous line represents the mean difference and dashed lines represent limits of agreement (mean difference (2SD)).
The sensitivity of non-invasive methods to detect severe aortic stenosis (⩽ 0.80 cm2 as defined by cardiac catheterisation) was calculated to be 78% for CMR, 70% for TOE, and 74% for TTE. The specificity to detect severe aortic stenosis was calculated to be 89% for CMR, 70% for TOE, and 67% for TTE, indicating that CMR planimetry may give the best non-invasive reflection of catheterisation results for the detection of severe aortic stenosis compared with all other non-invasive methods
Figure 3 shows the capabilities of CMR imaging to evaluate even heavily calcified aortic valves (middle panel). The valve shown could not be assessed by TOE, since it was not possible to define all commissural areas (right panel). Application of the continuity equation based on TTE assessments was also limited in this case because of a poor acoustic window and calcified deposits in the outflow tract annulus (left panel). In this patient even invasive evaluation by catheterisation turned out to be difficult because the calcified valve could not be crossed with the catheter.
DISCUSSION
In the present study we found CMR planimetry of AVA to have low intraobserver and interobserver variability indicating reliability and reproducibility of our approach. This is consistent with the data recently reported by John and colleagues.26 Furthermore, we showed that CMR planimetry has the best sensitivity and specificity for the detection of severe aortic stenosis in comparison with all non-invasive methods, on the basis of cardiac catheterisation, which is regarded as the ideal by many authors.25 CMR is well tolerated and is independent of acoustic windows. CMR imaging also provides additional information regarding global and regional left ventricular function27–29 and it can determine accurately the extent and pattern of left ventricular hypertrophy.15,20,30
CMR planimetry
Since conventional gradient echo CMR provides insufficient image quality due to flow artefacts and valvar calcification, reliable AVA measurement by CMR was not possible in the past. Our results clearly indicate that the use of new SSFP sequences almost completely eliminates these technical limitations. With the use of SSFP, signal intensity of the blood pool is related largely to the ratio of T2 to T1, which is high for blood and lower for myocardium, pericardium, or similar structures. Therefore SSFP signal intensity is widely independent of blood flow in contrast to a conventional gradient echo signal,31 making SSFP robust against turbulent flow or impaired cardiac output.15–21 In addition, the contrast to noise ratio and signal to noise ratio are significantly higher for SSFP than for conventional gradient echo CMR, leading to superior definition of structural borders. Moreover, susceptibility artefacts caused by calcifications are reduced significantly.15,18–20 Thus, the visualisation of valvar structures is significantly improved compared with gradient echo CMR.17
Limitations of CMR planimetry
However, some limitations remain, including the contraindications to CMR in general—pacemaker or metallic implants.32 Rarely, severe claustrophobia prevents examination by CMR, as was the case with two of our patients (table 1). In patients with severe cardiac arrhythmias such as poorly controlled atrial fibrillation, trigger problems can result in reduced image quality. Importantly, in the six patients with rate controlled atrial fibrillation in this study image quality was not reduced. Furthermore, calcification of the aortic valve as well as turbulent flow caused by aortic regurgitation can cause signal void, which can make edge discrimination of the valve leaflets difficult. Since calcifications are usually not located along the inside of the valve as part of a cusp,25 treating signal void as part of the cusp should not result in underestimation of the true AVA. Corresponding to this expectation we found a good correspondence between TOE and CMR in patients in whom AVA determination by TOE was possible. Our findings are also consistent with the findings of John and colleagues,26 who evaluated 40 patients by CMR and TOE.
Comparing CMR with other methods
There were no significant differences in agreement of CMR with cardiac catheterisation, TOE, or TTE. However, there was a trend towards overestimation of AVA measured by CMR and TOE in comparison with catheterisation and TTE. This is not surprising since CMR and TOE determine the anatomical valve area, which is expected to be a little greater than the effective (functional) area measured by cardiac catheterisation and TTE.
The relatively wide range in limits of agreement found in the present study reflects the small patient population, as well as limitations of the different methods. For instance, the precision of the area measured by catheterisation is reduced in patients with low cardiac output. On the basis of our finding that CMR is largely independent of haemodynamic status, calcification, or acoustic window, most of the scattering in our data may indeed be caused by limitations of cardiac catheterisation and of echocardiography. This hypothesis is supported by the tendency for better agreement of CMR and cardiac catheterisation or TTE when only patients with isolated aortic stenosis were evaluated (see Results). When compared with cardiac catheterisation, we found CMR to have the best sensitivity and specificity of the non-invasive methods to detect severe aortic stenosis, which confirms recent observations.33
However, although many diagnostic methods are available, exact assessment of the severity of aortic stenosis remains difficult, since all available techniques have limitations. Estimating AVA by TTE with the continuity equation has become the technique applied most frequently in clinical routine because it is not invasive and is easily available. Sources of error lie in determining left ventricular outflow diameter, especially in patients with poor acoustic windows or calcified deposits in the outflow tract annulus.4,8,9,34,35 If the ultrasound beam is not directed parallel to the velocity jet peak transvalvar velocity may be missed and hence the gradient may be underestimated. Moreover, it may be difficult to determine the exact subvalvar velocity because flow velocity is not stable but increases gradually in the upper left ventricular outflow tract, leading to overestimation or underestimation of AVA when measured too distal in the left ventricular outflow tract or too close to the aortic valve.3 Furthermore, the continuity equation is not valid in patients with subvalvar dynamic obstruction.
The most significant limitation when using the transoesophageal approach for direct planimetry of AVA is any calcification of the aortic valve, because the acoustic shadow behind the calcification often projects into the aortic valve orifice.10 There are two major reasons why TOE planimetry may be the least feasible of all techniques. Firstly, AVA cannot be quantified when it is not possible to define all commissural areas. Secondly, many patients with severe aortic stenosis often present with heavily calcified valves. Also in the study of Bernard and colleagues11 almost all valves were significantly calcified, resulting in unacceptably high intraobserver and interobserver variabilities.
Determination of AVA by cardiac catheterisation depends on correct measurements of flow through the aortic valve, which equals cardiac output in the absence of significant additional valvar lesions, and the transvalvar pressure gradient. When thermodilution is used to determine cardiac output, incorrect high AVA values may be obtained—that is, in the presence of tricuspid regurgitation36,37 or low cardiac output.38 When cardiac output is determined by the Fick principle based on estimations of oxygen uptake, coexistent lung diseases may cause errors in calculation. Correct measurement of the transvalvar pressure gradient requires a transvalvar placement of the catheter in the left ventricle, which is associated with risks.14 For optimal results a second catheter is needed in the proximal ascending aorta due to errors introduced when the peripheral arterial pressure is used as a substitute for the ascending aortic pressure.39 The Gorlin formula23 has limitations because the empirical constant can vary.12,13,40,41 Low flow states often result in underestimation of the AVA.13,41 The presence of concomitant aortic regurgitation may lead to underestimation of AVA.41 If mitral incompetence of more than trivial severity accompanies aortic stenosis, AVA cannot be assessed accurately because forward flow through the aortic valve cannot be determined accurately. Nevertheless, cardiac catheterisation is the technique with the largest clinical experience and it thus remains the standard against which new non-invasive methods must be judged.
Conclusion
Assessment of AVA with current diagnostic techniques has multiple limitations. Conversely, AVA planimetry with SSFP CMR imaging is widely independent of these limitations. In the present study, CMR planimetry has been shown to be highly reliable and reproducible. Furthermore, CMR planimetry was shown to have the best sensitivity and specificity of all non-invasive methods for detecting severe aortic stenosis in comparison with cardiac catheterisation. Therefore, CMR planimetry of AVA with SSFP is a new powerful diagnostic tool, particularly in patients with uncertain or discrepant findings by other modalities.
Acknowledgments
The investigators are indebted to the staff of the catheterisation and the echocardiography laboratories of the Robert Bosch Medical Centre, Stuttgart, Germany for their help in collecting the data reported in this paper.