Article Text

Abstract
Objective: To investigate whether persistent ischaemic dysfunction of the myocardium after dynamic stress can be diagnosed from changes in ultrasonic strain rate and strain.
Design: Prospective observational study, with age matched controls.
Setting: University hospital.
Patients and methods: 26 patients (23 men, mean (SD) age 58.9 (8.1) years) with coronary artery disease but no infarction and 12 controls (9 men, aged 56.1 (8.8) years) with normal coronary arteriography and negative exercise test underwent treadmill exercise (Bruce protocol). Tissue Doppler echocardiography was performed at baseline, at peak exercise, and at intervals up to one hour. Systolic and diastolic velocity, strain, and strain rate were recorded in the basal anterior segment of 16 patients with proximal left anterior descending coronary artery disease.
Results: Patients developed ischaemia, since they experienced angina, exercised for less time, and reached a lower workload than the control group, and had ST segment depression (−2.4 mm). Myocardial systolic velocity immediately after exercise increased by 31% and strain rate fell by 25% compared with increases of 92% and 62%, respectively, in the control group (p < 0.05). During recovery, myocardial systolic velocity and strain rate normalised quickly, whereas systolic strain remained depressed at 30 and 60 minutes after exercise, by 21% and 23%, respectively, compared with baseline (p < 0.05 versus controls). Myocardial diastolic velocities and strain rate normalised but early diastolic strain remained depressed by 32% compared with controls for 60 minutes (p < 0.05). Strain during atrial contraction was abnormal for 30 minutes.
Conclusions: Myocardial strain shows regional post-ischaemic dysfunction in systole and diastole and may become a useful diagnostic tool in patients presenting with chest pain with a normal ECG.
- stunned myocardium
- exercise
- tissue Doppler echocardiography
- strain rate imaging
- Doppler myocardial imaging
Statistics from Altmetric.com
- stunned myocardium
- exercise
- tissue Doppler echocardiography
- strain rate imaging
- Doppler myocardial imaging
The effects of acute myocardial ischaemia can be detected non-invasively from changes in global function of the ventricle,1 but coronary artery disease is a regional problem. Sensitive and reliable markers of regional dysfunction would greatly aid diagnosis—for example, in patients who present with chest pain or in patients with poor left ventricular function and multivessel coronary artery disease. In either group, persistent regional dysfunction may indicate ischaemia or viability in territories that may benefit from revascularisation.
Tissue Doppler echocardiography holds great promise as a non-invasive method of quantifying regional myocardial function objectively in coronary artery disease. It has been shown in experimental studies with implanted microsonic crystals that the velocity of regional myocardial motion correlates very closely with subendocardial blood flow.2,3 Such velocities can now be quantified by tissue Doppler echocardiography,4 which also allows measurement of regional contraction by parameters of myocardial deformation (strain) and deformation rate (strain rate).5 Regional left ventricular function is accurately described at rest and during acute and chronic ischaemia6–8 induced by dobutamine in animal models.9–11 Recent clinical studies have suggested that these indices will be useful for detecting dobutamine induced ischaemia and viability.12,13
To test the hypothesis that tissue Doppler echocardiography can show persistent regional myocardial dysfunction after a single episode of acute ischaemia, we investigated the consequences of maximum exercise in patients with coronary artery disease and in a healthy control group. We compared the changes and time course of recovery of regional myocardial velocity and strain with the use of tissue Doppler echocardiography.
METHODS
We studied 26 patients (23 men) with coronary artery disease (group A) who had been referred for investigation of chest pain and had undergone coronary arteriography as part of their routine investigations. All patients had a > 50% diameter stenosis (> 75% luminal area) in at least one major coronary arterial branch assessed by quantitative coronary arteriography. All had chronic stable symptoms and normal resting global and regional left ventricular function assessed by left ventriculography and cross sectional echocardiography. None gave a history of previous myocardial infarction. Patients with a history of uncontrolled hypertension or unstable angina within the preceding three months were excluded, as were patients with echocardiographic evidence of left ventricular hypertrophy or significant valvar disease.
We also investigated 12 control participants (nine men) (group B) who had normal coronary arteriography performed for the investigation of atypical chest pain. All had undergone negative, maximum, Bruce protocol exercise testing, and they had a low probability of coronary artery disease (< 15% over 10 years).
The study was approved by the local research ethics committee and all participants gave written informed consent.
Coronary arteriography
All patients and controls had coronary arteriography within three months before inclusion in the study in standard projections (Integris H5000, Philips, Einthoven, the Netherlands). Images were stored on CD Rom and coronary arteriography was quantified off line by an independent trained observer who was blinded to the tissue Doppler data. Myocardial segments were described as being supplied by a normal coronary artery (no disease or < 50% stenosis) or by a diseased vessel (> 50% stenosis) by published methods to match coronary arteries with segments.14 In group A, 23 had disease in the left anterior descending coronary artery (LAD), 12 in the right coronary artery, and 16 in the circumflex artery. In all, 13 of 78 major coronary arteries were occluded (LAD four, circumflex four, right coronary artery five) but all distal vessels had good collateral supply. Since there were no pathological Q waves on the surface ECGs or regional wall motion abnormalities on the resting echocardiographic studies, the segments supplied by these vessels were interpreted as non-infarcted and at risk for ischaemia.
Study protocol
All participants had serial echocardiography before and after a maximum symptom limited treadmill exercise test (Bruce protocol) (Marquette GE, Milwaukee, Wisconsin, USA). Two dimensional echocardiography was performed at baseline, immediately after peak exercise (within two minutes), and then 15 and 30 minutes later. Fourteen patients and all 12 in the control group had a further echocardiogram after 60 minutes; the other 12 patients underwent repeat exercise testing after 30 minutes as part of a different protocol and therefore data at 60 minutes are not reported for these patients. Patients remained on bed rest during the study. β Blockers were discontinued 72 hours before testing and other cardiovascular medication was withheld on the day of testing except for short acting nitrates. Any patient who developed angina during this period before testing was excluded and medication was restarted. All medication was restarted four hours after exercise testing.
A 12 lead ECG was recorded at baseline, every three minutes during the test, and every two minutes in recovery. ECG leads II, V2, and V5 were monitored during the test. Blood pressure was recorded at the same times as the 12 lead ECG recordings. End points for the exercise test were significant ST segment depression (> 2 mm in two contiguous leads, measured 80 ms after the J point), intolerant symptoms of angina, achieving a target heart rate of 220 beats/min minus the patient’s age in years, or exhaustion.
Echocardiography
Echocardiograms were obtained with a commercially available machine (System V, GE Vingmed, Horten, Norway) and a 2.0 MHz phased array transducer. Patients were examined in the left lateral decubitus position and images were acquired at passive end expiration to minimise global cardiac movement from standard parasternal long and short axis and apical four and two chamber planes. Grey scale imaging was obtained with native tissue harmonics.
Tissue Doppler studies
In each imaging plane during each study, complete digital data were acquired over three heart cycles, with colour coded Doppler myocardial velocities superimposed on standard grey scale two dimensional images. Care was taken to maintain frame rates of > 145 frames/s by keeping the angle of insonation as small as possible (ideally < 30°) and the depth of field low enough just to include the left ventricle only. Images were stored on a personal computer (Macintosh G3) and transferred to magneto-optical and compact disks. The stored digital data were analysed off line by dedicated software (TVI v60, GE Vingmed, Horten, Norway).
Myocardial velocities throughout the cardiac cycle were measured according to the American Society of Echocardiography 16 segment model.15 Each region was analysed to retrieve real time velocity and strain rate curves. Myocardial walls were divided by four equidistant points into three equal segments and a semiautomated tracking algorithm was applied to continuously sample the area of interest throughout the cardiac cycle. Regional strain rate was estimated as the spatial derivative of myocardial velocity over a user defined computation distance16,17 set at 5 mm for calculations of both radial and longitudinal strain rate. Velocity and strain rate profiles were averaged over three cardiac cycles.
Natural strain was obtained by integrating the strain rate profile with custom made software (Speqle, KU Leuven, Leuven, Belgium; see Appendix). Strain was computed from end diastole, defined as the R peak on the ECG. Tissue Doppler velocity traces were used to determine the timing of aortic valve closure (end systole), which causes an abrupt change in the myocardial velocity profile in basal segments coinciding with peak negative left ventricular dP/dt, as previously described.18 Mitral valve opening was determined at the tip of the mitral valve leaflets from an anatomical M mode echocardiogram. To describe regional motion and deformation in the radial and longitudinal directions, the following parameters were extracted from the mean velocity and strain rate profiles: maximum systolic velocity and strain rate, maximum early diastolic velocity and strain rate, and maximum late diastolic velocity and strain rate. Changes in diastolic parameters were analysed only when early and atrial phase components were not fused.
From the mean strain profile, we calculated end systolic strain, which is the magnitude of deformation at end systole, compared with the reference starting length at end diastole (see Appendix). By convention, normal long axis systolic shortening of the left ventricle is expressed in negative strain rate and strain values, although it results from compression that produces radial thickening, whereas diastolic lengthening and thinning (expansion) are expressed in positive values. Long axis function was assessed from basal, mid, and apical segments of the septal, lateral, inferior, and anterior walls in apical planes,19 whereas radial function was assessed in the posterior wall segments from a parasternal image.
Statistical analysis
Statistical analysis was performed with SPSS for Windows (SPSS, version 10.0.5, Chicago, Illinois, USA) and SPLUS (version 6, Insightful, Seattle, Washington, USA). Continuous demographic data were expressed as mean (SD) and compared by the unpaired t test. Categorical demographic data are expressed as number (%) and compared by Fisher’s exact test. Tissue Doppler data are expressed as mean (SD) in the text and tables and as absolute changes from baseline with SEM error bars in the figures. For each segment, serial changes in tissue Doppler parameters between groups over time were analysed by repeated measures analysis of variance. For each parameter, the effect of group, time, and group by time interaction was assessed. Within patient contrasts were tested to compare each time point with the baseline. A probability value of p < 0.05 was considered significant.
For the assessment of intraobserver variability of tissue Doppler measurements, stored digital studies from eight randomly selected patients were analysed four times by the same observer (RIW) at baseline, low dose, and peak. Pooled standard deviations and coefficients of variation were calculated for velocity and timing parameters. Only pooled standard deviations were calculated for strain rate and strain data, since these can be positive or negative. Intraobserver reproducibility of quantitative coronary arteriography was determined by repeated analysis of 18 lesions; the data were compared by the method of Bland and Altman.20
RESULTS
Study groups
The 26 patients (group A) and the 12 controls (group B) were matched for age, resting heart rate, and blood pressure (table 1). In group A, nine patients had single vessel disease, nine had double vessel disease, and eight had triple vessel disease, giving totals of 23 patients with LAD disease, 16 with circumflex artery disease, and 12 with right coronary artery disease; table 2 summarises the mean percentage stenoses. Patients were prescribed more β blockers, calcium channel blockers, nitrates, and aspirin than group B (table 1). There was a non-significant excess of diabetic patients in group B (p = 0.108).
Description of study groups
Quantitative coronary angiography: degree of stenosis by artery
Effects of exercise
The mean exercise time was 20% shorter in group A than in group B (p = 0.034) (table 1). In group A, 16 patients (61%) developed typical cardiac chest pain, nine patients (35%) had dyspnoea, and one patient without pain stopped the test when he had 4.5 mm of downsloping ST segment depression. Mean ST depression was −2.4 (1.3) mm (p < 0.001 v controls). All symptoms and ECG changes had resolved within six minutes after exercise in all patients. All participants in group B were limited by fatigue or dyspnoea, and none developed chest pain or ST segment depression > 0.5 mm. Both heart rate and systolic blood pressure increased at peak exercise in group A and group B (all changes, p < 0.001), but peak heart rate and peak double product were lower in group A than in group B (by 21 beats/min and 4.3 × 103 mm Hg.min, respectively, both p ⩽ 0.001) (table 1).
Myocardial velocities
Regional myocardial responses to ischaemia were tested in the basal anterior segment in 16 patients in group A who had proximal disease of the LAD. In these patients, myocardial peak systolic velocity in the basal anterior segment was increased immediately after maximum exercise, by 31% (table 3, fig 1), whereas it was increased by 92% in group B (p = 0.05 v group A). Fusion of early and late diastolic velocity and strain rate profiles was seen in 17% of recordings from the basal anterior segment at peak exercise. Myocardial diastolic velocities during early filling and atrial contraction were unchanged immediately after exercise in group A (−1% and −6%), but both were increased in amplitude in group B (56%, p = 0.05 v group A; and 60%, p = 0.003 v group A) (table 3, fig 1).
Absolute values for myocardial velocities, strain rate, and strain recorded in the basal anterior segment at rest, immediately after exercise, and during recovery

Absolute changes (δ) in systolic (sys), early diastolic (E), and late diastolic (A) profiles of myocardial velocities (V), strain rate (SR), and strain (ε) recorded in the basal anterior segment immediately after exercise (peak (PK)) and at 15, 30, and 60 minutes’ rest afterwards, in patients with disease of the left anterior descending coronary artery (group A; open bars) and in healthy controls (group B; solid bars). *p < 0.05 for comparisons between group A and group B.
Strain and strain rate
In group A, longitudinal systolic strain rate was reduced in amplitude by 25% at peak exercise compared with baseline, whereas group B had a normal increase in systolic strain rate immediately after exercise (62%, p = 0.003 versus group A) (table 3, fig 1). There were comparable changes in systolic strain, which fell immediately after exercise by 36% in group A and increased by 30% in group B (p = 0.005 v group A).
Long axis diastolic strain rate increased immediately after exercise in group B, by 37% during early diastole and by 61% during atrial contraction. Comparable diastolic strains increased by 11% and 37%. The responses in group A were all blunted and in the opposite direction compared with group B (p < 0.05 for all comparisons) (table 3, fig 1). Early diastolic strain rate and strain were reduced in amplitude by 25% and 38%, and strain rate and strain during atrial contraction were reduced by 29% and 25% from baseline values.
Recovery
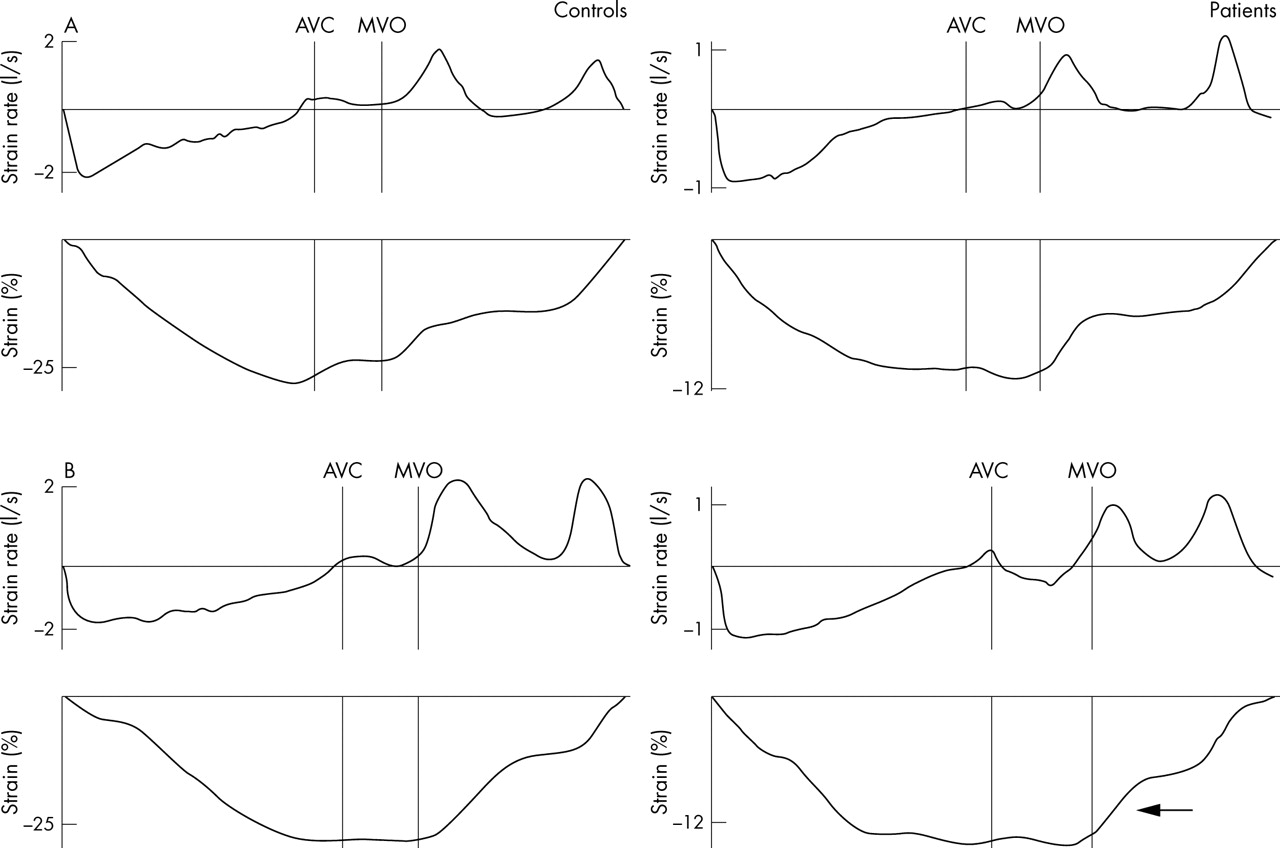
All myocardial velocities and strain rates in groups A and B, both in systole and in diastole, had returned to normal (pre-exercise baseline) by 15 minutes and remained normal thereafter. Persistent changes were observed only in systolic and diastolic strain (table 3, fig 1). Figure 2 illustrates representative traces. Figure 3 illustrates changes in early diastolic strain in individual patients and controls.

Examples of typical SR and strain curves recorded during one cardiac cycle from the basal anterior segment at rest (upper traces, A) and 15 minutes into recovery (lower traces, B) after a maximum exercise test by a control participant (left hand traces) and a patient (right hand traces). Note that baseline SR and strain measurements are higher for the control; the traces for the patient are displayed on a different scale. During recovery, E strain recovers rapidly in the control, whereas the recovery of E strain is delayed in the patient (⇐). AVC, timing of aortic valve closure; MVO, timing of mitral valve opening.
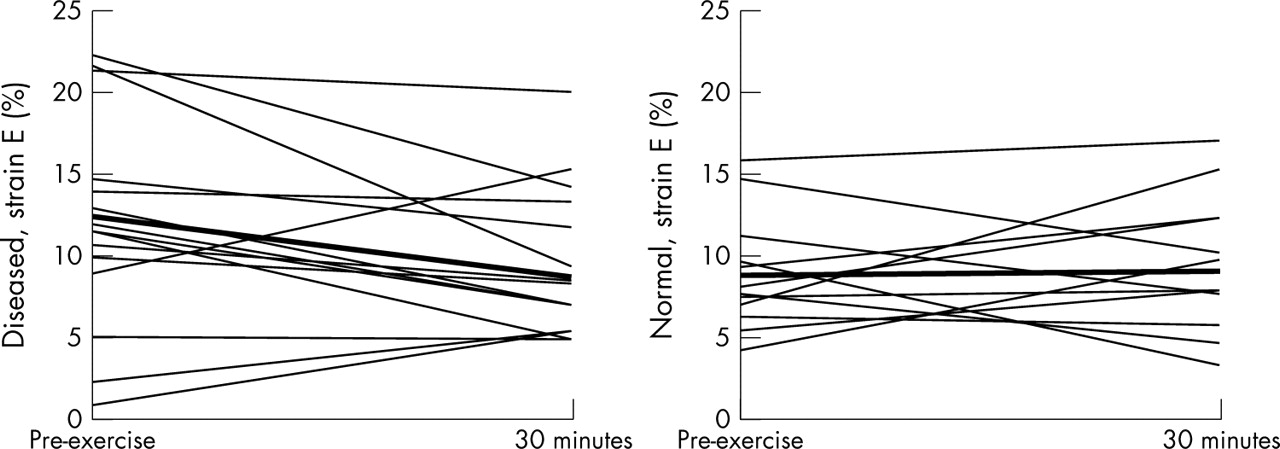
E strain profile in individual patients (left hand panel) and controls (right hand panel) at baseline and 30 minutes after maximum treadmill exercise, illustrating a fall in E strain in patients compared with a normalisation to baseline levels in controls.
Systolic strain
The amplitude of systolic strain in the basal anterior segment remained depressed in group A for up to 60 minutes after exercised induced ischaemia (by −9%, −21%, and −23% at 15, 30, and 60 minutes, respectively, compared with baseline) whereas in group B strain increased after exercise and remained constant thereafter (changes from baseline 24%, 18%, and 27% at 15, 30, and 60 minutes, respectively). The differences between groups were significant at 30 minutes (p = 0.017) and at 60 minutes (p = 0.028) after exercise (fig 1).
Diastolic strain
In group A early diastolic strain was lower than baseline values by 21%, 21%, and 32% at 15, 30, and 60 minutes, respectively, whereas in group B there were small but insignificant increases at all time points. The amplitude of myocardial strain during early diastole in the basal anterior segment was reduced compared with group B for at least one hour after exercise induced ischaemia (p = 0.023) (table 3, fig 1). Changes in strain during atrial contraction differed similarly between the groups and were significant at 15 and 30 minutes after exercise (p = 0.027 and p = 0.015, respectively) (table 3, fig 1). In group A the changes in strain during atrial contraction were −12%, −8%, and −10% at 15, 30, and 60 minutes, respectively.
Reproducibility
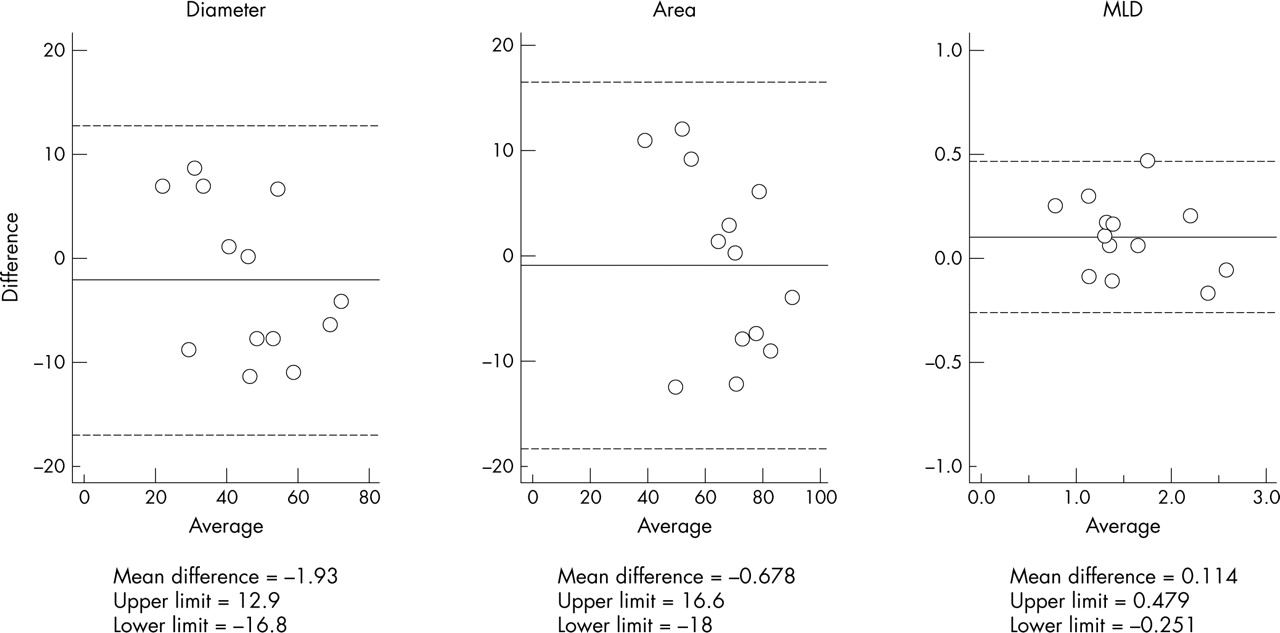
Tissue Doppler data were obtained from 1440 segments, of which 72 (5%) had to be excluded during subsequent analysis because the traces could not be interpreted due to artefact; a total of 23 256 observations of velocity, strain rate, and strain parameters were made. Table 4 summarises coefficients of variation and pooled standard deviations for measurements in the basal anterior segment. Figure 4 shows angiographic reproducibility.
Intraobserver variability of tissue Doppler parameters measured in the basal anterior segment

Bland Altman plots for paired measurements of coronary arterial diameter, luminal cross sectional area, and minimum luminal diameter (MLD) obtained on quantitative coronary arteriography. Upper and lower limits in all plots are mean (2 SD).
DISCUSSION
We have shown that myocardial systolic and diastolic strain measured by tissue Doppler echocardiography identifies persistent regional dysfunction after a single episode of exercise induced ischaemia. These changes may indicate regional myocardial stunning.
Myocardial stunning
Myocardial stunning is the contractile dysfunction that persists after ischaemia in the absence of necrosis, despite the restoration of blood flow.21 Global left ventricular stunning occurs in patients with coronary artery disease after a single episode of ischaemia.22 Repeated exercise induced ischaemia can cause prolonged depression of global systolic and diastolic function despite rapid normalisation of haemodynamic and ECG changes.1 Repeated episodes of stunning thus lead to myocardial hibernation, which is clinically important because successful revascularisation will restore function.
Stunning has been shown with tissue Doppler echocardiography in animal models,9,18 but it has been more difficult to observe in humans. This is because ischaemia is a regional problem and the time course of recovery is also variable and may be related to the severity of the ischaemic insult and to the maturity of the collateral circulation. There is growing evidence that stunning in humans is cumulative with repeated episodes of ischaemia.23,24 Our study suggests that regional stunning can be diagnosed with non-invasive measurements of myocardial strain.
Myocardial tissue Doppler responses in healthy patients
In our study there were small baseline differences between groups, with generally lower measurements in group B, although these did not reach significance. This might be due to a rebound increase in myocardial velocities as a result of the withdrawal of β blocker medication two days before the study in 69% of patients. Alternatively, the baseline parameters may have been lower in the control group due to the small excess in the number of diabetic patients in this group compared with group A, since diabetes is associated with reduced resting long axis velocities.25 Despite this, the control group achieved a 94% increase in regional systolic velocity and a 70% increase in strain rate from rest to immediately after exercise, associated with normal haemodynamic and physiological responses.
Other velocity based studies have shown that there is an almost linear increase in regional systolic velocity in normal myocardial segments in response to stress.26,27 It has also been shown experimentally that regional systolic strain rate increases linearly during dobutamine stress and correlates with the rate of change of left ventricular pressure (dP/dt).28 In our study, the response of systolic strain was different, since it did not increase significantly at peak exercise. In a previous report of tissue Doppler response to dynamic stress and dobutamine, end systolic strain response was biphasic, since it increased at low heart rates but then reached a plateau or fell at higher heart rates.29 Reductions of end systolic strain have been reported at heart rates > 150 beats/min that correlate with the reduction in left ventricular stroke volume.9,28 This biphasic response has also been observed previously in normal hearts during exercise.30 It is probably the result of shortening of diastolic filling times leading to reduced preload and stroke volume. In our study we did not observe a biphasic response, since no echocardiographic images were acquired during treadmill exercise.
The normal control group had no evidence of coronary ischaemia on repeated negative maximum exercise testing, and absolutely normal coronary arteries on angiography. They were investigated for chest pain, however, and a considerable number of the group were smokers and diabetic. We cannot exclude the possibility that these factors may have predisposed them to early atherosclerosis with positive remodelling, nor that these participants might have had some endothelial or microvascular dysfunction. However, they would not fulfil the criteria for microvascular angina, as they had repeated negative exercise tests. It would be difficult to study a more normal control group, since we would be unable to gain ethical consent to subject normal volunteers with no symptom to angiography. Most importantly, the possible influence of these factors on myocardial velocities would tend to reduce the differences between the ischaemic patients and the control group, rather than to increase them; therefore, in our opinion, the findings that we report are likely to be real.
Myocardial tissue Doppler responses in ischaemic patients
The patients with coronary artery disease achieved an increase of regional systolic velocity immediately after exercise of only 31%, whereas peak systolic strain rate decreased by 35% and systolic strain fell by 57%. The small rise in systolic velocity may well be related to the effect of tethering from adjacent, non-ischaemic segments; the same phenomenon was seen in 28% of patients in the study by Kukulski and colleagues.31 The observed falls in strain rate and strain confirm that the patients had developed significant myocardial ischaemia during exercise; similar acute changes in strain rate have been observed in patients experiencing hyperacute ischaemia during coronary angioplasty.31–33
Myocardial diastolic velocities and strain rates were increased in the control group immediately after exercise, possibly reflecting increased preload, although changes immediately after dynamic exercise have not been studied in detail and they were not the primary objective of the current study. In the patients with myocardial ischaemia, both early and late diastolic velocities were unchanged. Similar patterns of changes in diastolic velocities in normal and ischaemic segments have been observed during pharmacological stress with dobutamine,34,35 although in the study by Najos-Valencia and colleagues,35 diastolic measurements were hampered by fusion of myocardial early and late velocities. In our study, diastolic strain rates in ischaemic segments fell immediately after exercise, by 24% in early diastole and by 28% during atrial contraction, whereas both strain rates increased in the control group. These differences between diseased and normal diastolic regional deformation may be sensitive indicators of increased subendocardial “stiffness” in the presence of ischaemia.36
Delayed recovery of regional function in diseased segments
Blood pressure and heart rate returned to baseline within nine minutes. Velocity and strain rate parameters all returned quickly to baseline levels, so that there were no sustained differences at 15 minutes after maximum exercise. Thus, this study suggests that these parameters cannot be used to detect persistent dysfunction in myocardial segments that are affected by stunning.
The major changes were observed in myocardial strain. Regional systolic strain was depressed for up to 60 minutes; the change at 15 minutes was not significant perhaps because of increased variability in the measurements at this time or because the loading of the ventricle had not yet returned to baseline. Early diastolic strain also remained depressed for 60 minutes compared with the control group. These phenomena cannot be explained by changes in heart rate, as these had normalised, and so the phenomena may be the effects of myocardial stunning. To our knowledge, persistent abnormalities of regional diastolic strain after exercise induced ischaemia in humans have not been reported before. They therefore merit further investigation as possible non-invasive markers of stunned myocardium. Before these markers can be applied in routine clinical practice, it will be necessary carefully to define normal values in large control populations.
Effect of collateral flow
The impact of collateral circulation on myocardial function has been known for many years.37,38 Collaterals protect areas at risk of acute ischaemia during angioplasty.39 In our study, we considered all segments that were in the territory of a collateralised coronary artery to be “at risk” of ischaemia and included these segments in the analysis. Segments protected by Rentrop grade 2 and 3 collaterals retain higher strain rate and strain values during ischaemia than segments that are unprotected, so our study may have underestimated the sensitivity of changes in strain rate and strain in the recovery phase when the blood supply changes from predominantly collateral to antegrade.31
Study limitations
Acquisition and offline analysis of tissue Doppler data from multiple myocardial segments at many time points can be time consuming, but with automated analysis of selected parameters according to the results of research studies these methods may be applicable in clinical practice. In our study more than 90% of segments were analysable. Reproducibility was high and comparable with other quantitative techniques and software.19,29,40 With current techniques, strain rate data are noisy and so they should be averaged over several cardiac cycles, meaning that rapid acquisition of data may be compromised to obtain high quality traces. Strain rate and strain are also angle dependent,16,17 but care was taken to ensure that the angle of insonation was kept as low as possible.
Data were acquired as quickly as possible after the end of treadmill exercise (within two minutes), but large physiological changes have already occurred by this time. These include a fall in heart rate, blood pressure, cardiac output, and vascular resistance and an increase in ejection fraction and end systolic volume. There is also reversal of splanchnic vasoconstriction that affects myocardial loading.41 Possible effects of these changes on load dependent variables cannot be avoided, but the objective of this study was to investigate changes after systemic haemodynamic function had returned to normal, and this was achieved.
APPENDIX
STRAIN RATE
Strain rate (SR) is the rate of deformation of an object. Local myocardial strain rate (/s) can be calculated from the spatial gradient in velocities recorded between two neighbouring points in the tissue (for example, points 1 and 2 with velocities V1 and V2):

with L reflecting the distance between points 1 and 2.16 When a segment thickens in the radial direction, SR is defined to have a positive value. When a segment thins in the radial direction, it is characterised by a negative value. Conversely, when a segment thickens in systole and shortens in the longitudinal direction, SR is negative, and when a segment thins in the longitudinal direction, it is positive.
STRAIN
Regional strain (ε) is obtained by integrating the regional SR curve over time. ε defines the relative amount of local deformation caused by an applied force.16 Myocardial radial ε increases during myocardial thickening (or compression) and decreases during thinning (or expansion); normal longitudinal systolic ε is negative and diastolic ε is positive. The ultrasound technique estimates the instantaneous change in segment length, or natural ε value (εN),16 which is expressed as a percentage and is described by the equation:

where t0 is a reference time point, t is the instant time point, and dt is an infinitesimally small time interval.
Acknowledgments
RIW, NP, and TP were supported by a British Heart Foundation Project Grant (99/048).
REFERENCES
Linked Articles
- Miscellanea
- Miscellanea