Article Text

Abstract
Objective: To evaluate how well patients with non-valvar atrial fibrillation (NVAF) were maintained within the recommended international normalised ratio (INR) target of 2.0–3.0 and to explore the relation between achieved INR control and clinical outcomes.
Design: Record linkage study of routine activity records and INR measurements.
Setting: Cardiff and the Vale of Glamorgan, South Wales, UK.
Participants: 2223 patients with NVAF, no history of heart valve replacement, and with at least five INR measurements.
Main outcome measures: Mortality, ischaemic stroke, all thromboembolic events, bleeding events, hospitalisation, and patterns of INR monitoring.
Results: Patients treated with warfarin were outside the INR target range 32.1% of the time, with 15.4% INR values > 3.0 and 16.7% INR values < 2.0. However, the quartile with worst control spent 71.6% of their time out of target range compared with only 16.3% out of range in the best controlled quartile. The median period between INR tests was 16 days. Time spent outside the target range decreased as the duration of INR monitoring increased, from 52% in the first three months of monitoring to 30% after two years. A multivariate logistic regression model showed that a 10% increase in time out of range was associated with an increased risk of mortality (odds ratio (OR) 1.29, p < 0.001) and of an ischaemic stroke (OR 1.10, p = 0.006) and other thromboembolic events (OR 1.12, p < 0.001). The rate of hospitalisation was higher when INR was outside the target range.
Conclusions: Suboptimal anticoagulation was associated with poor clinical outcomes, even in a well controlled population. However, good control was difficult to achieve and maintain. New measures are needed to improve maintenance anticoagulation in patients with NVAF.
- AF, atrial fibrillation
- ICD, International classification of diseases
- INR, international normalised ratio
- NVAF, non-valvar atrial fibrillation
Statistics from Altmetric.com
- AF, atrial fibrillation
- ICD, International classification of diseases
- INR, international normalised ratio
- NVAF, non-valvar atrial fibrillation
It has been estimated that 470 000 patients received oral anticoagulation in 2001 in the UK.1 This number is likely to increase as the number of people in the elderly population increases.2 Furthermore, there are plans to identify all patients with atrial fibrillation (AF) through primary care screening as part of a national stroke prevention strategy implemented in 2004.3
Long term anticoagulation treatment of patients with non-valvar atrial fibrillation (NVAF) can reduce the annual risk of stroke by two thirds.4,5 Such treatment compares favourably with the alternative, aspirin treatment.6 However, the pharmacokinetic profile of warfarin is complex,7 and monitoring is required to avoid both thromboembolic events associated with low intensity anticoagulation and haemorrhagic complications associated with higher intensity. Target levels of oral anticoagulation are disease specific and measured with the international normalised ratio (INR). In the case of NVAF, the range is 2.0–3.0. To attain INR values within this range, patients are routinely monitored and their doses are adjusted when necessary. In practice, it is recognised that long term stability is difficult to achieve because of unexpected fluctuations of the INR values in patients, which can be attributed to numerous factors including change in diet, poor compliance with medication, alcohol consumption, seasonal variation, and drug to drug interactions.7–9
The objective of the study was to evaluate how well patients with NVAF were maintained within the recommended INR target of 2.0–3.0 and to explore the relation between achieved INR control and clinical outcome.
PARTICIPANTS AND METHODS
Data sources
Three sets of data routinely collected in the UK were used: inpatient data from April 1995 to March 2000 containing a range of information including discharge diagnosis (International classification of diseases, 10th revision (ICD-10)), length of stay and operative procedures (Office of Population, Censuses and Surveys); haematology laboratory reports dating from June 1995 to January 2002 containing details of INR monitoring test results (including any initiated by a primary care source); and mortality data derived from the UK Office of National Statistics from January 1995 containing information on cause of death (ICD-9). These data underwent a process of record linkage to identify those records relating to the same patient both within and between the contributory datasets by using probability matching algorithms.10 The epidemiology of stroke11 and heart disease12 has been described previously in this same population with virtually identical methods.
Participants
The study was conducted in Cardiff and the Vale of Glamorgan, a largely urban area of South Wales with a population of 424 000 (2001 census). Patients were those identified during the period with a diagnosis of AF (ICD-10 code I48) recorded on inpatient admission and a minimum of five INR recordings before and after their initial NVAF admission. These patients were assumed to be taking oral anticoagulation in the form of warfarin, although no direct data on drugs or dosage were available. Patients were excluded if they had any record of heart valve procedures (appendix 1) before the first recorded AF diagnosis because the target INR range is higher for this indication.7
Linear interpolation and target range
To estimate the proportion of time that a patient was within the normal range, we assumed that the actual difference in INR between any two consecutive measurements was linear, and the data were interpolated accordingly.13 Time in target range for each patient was assessed by the percentage of interpolated INR values within the target range of 2.0–3.0.
Statistical analyses
The patterns of INR testing were analysed by calculating the time in days between consecutive INR tests for each patient. The relation between the intensity of INR and duration of warfarin treatment was investigated by plotting the average percentage of time in range versus the time in months after initial warfarin treatment. Patients who had an INR reading within six weeks of the earliest available data were omitted from this analysis, as it was not possible to determine whether an INR value was a first reading or a subsequent reading.
Multivariate logistic regression was applied to the data to assess whether poor control was associated with mortality and post-AF clinical events—namely, bleeding, thromboembolic events, and ischaemic stroke (appendix 2). All the models included age, sex, and hospital length of stay at first recorded AF admission (an indicator of morbidity at baseline), with the models for clinical events including a term for any pre-AF occurrences of the event. Regression models were then constructed through the individual inclusion of terms relating to different aspects of INR control. The mean INR and the standard deviation of INR terms were related to the raw INR data, with the odds ratios constructed for 0.1 unit changes in INR. We constructed odds ratios for the percentage time in and out of range variables where there was a 10% change in the variable of interest.
RESULTS
From the 222 398 patients hospitalised during the study period we identified 6247 patients with AF and excluded 139 (2.2%) on the basis of a history of heart valve surgery. The remainder, 6108, had NVAF; of these patients, 2828 (46.3%) had any INR reading and 2223 (36.4%) had more than four INR readings. These 2223 patients constituted the study group, for whom there were 135 149 actual INR readings and 2 118 881 follow up days for which values were calculated. This group had a crude population prevalence of 0.53% and an age specific prevalence of 4.5% in those older than 75 years; 53.1% were men with a mean (SD) age of 69.8 (11.0) years at the time of the first recorded AF event (table 1). The corresponding mean (SD) age for women was 75.6 (9.0) years. No clear relation was evident between age at first recorded AF diagnosis and mean INR; however, average length of hospital stay and the proportion of deaths within three months of the first recorded AF event increased noticeably with increasing age (table 1).
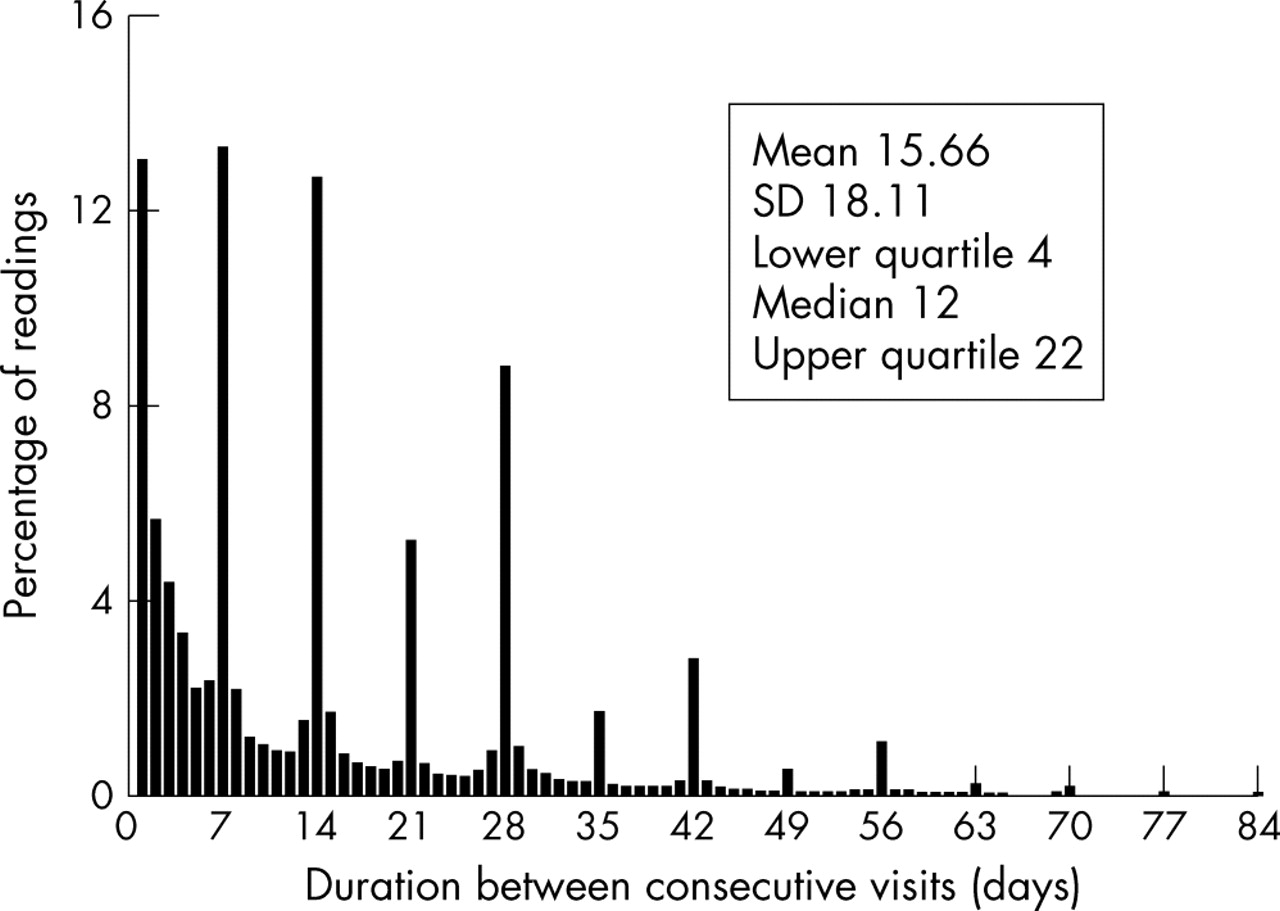
There was a clear pattern of consecutive clinic visits occurring either weekly (13.3%), bi-weekly (12.7%), or monthly (8.8%) (fig 1). The mean (SD) time between consecutive visits was 15.7 (18.1 days), with a median of 12 days and an interquartile range of 4–22 days. Of the 137 507 INR measurements, 46.6% were outside the target range.
In a plot of interpolated INR values, the distribution of INR intensity is asymmetrical and positively skewed (fig 2). Under these conditions, the mean (SD) INR value was 2.5 (0.69), with a median of 2.4 and an interquartile range of 2.4–2.8. In a plot of interpolated data, patients were outside the target range 32.1% of the time, with 15.4% of INR values > 3.0 and 16.7% of INR values < 2.0. However, division of the patients into quartiles based on proportion of time spent in target range highlighted that these average figures disguised a wide variation in the time spent out of target range. On average, patients in the quartile with worst control were out of target range for 71.6% of the time, as compared with 16.3% in the best controlled quartile.
Figure 3 shows the relation between the proportion of results within, above, and below the desired INR range of 2.0–3.0 by duration of treatment. The proportion of INR results outside the desired target range decreased as the duration of warfarin treatment increased, ranging from 52% outside the target range in the first month and decreasing to 30% after two years of monitoring.
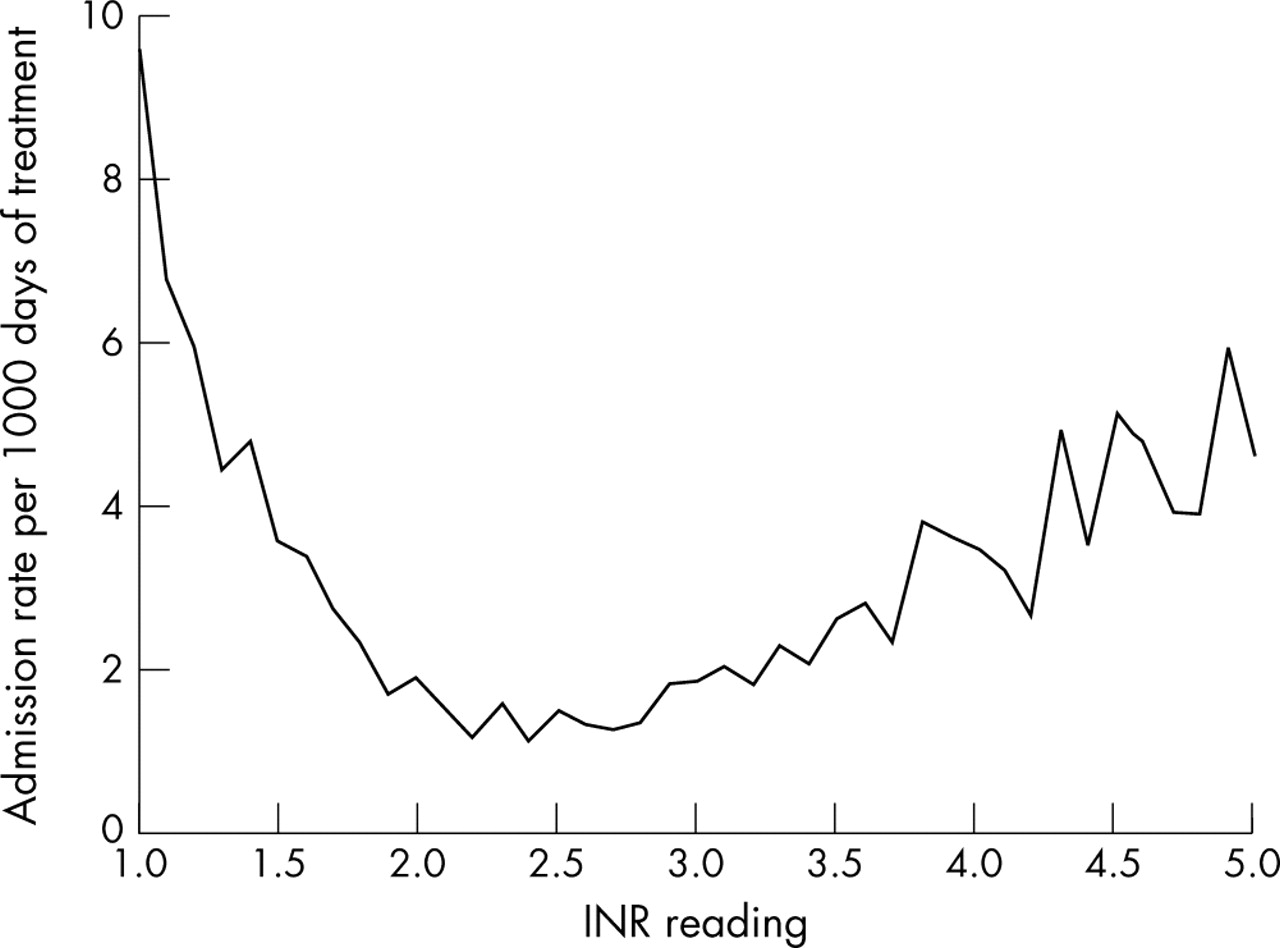
There were 5350 hospital admissions for patients from the study group after the initial admission with a diagnosis of NVAF. The rate of hospitalisation increased the further the INR value deviated from the target range (fig 4). The rates of admission were lowest when the INR value for the day before admission was towards the midpoint of the target range.
Multivariate logistic regression models showed that an increased risk of all cause mortality, ischaemic stroke, and all post-AF thromboembolic events was associated with poor warfarin control measured in various ways (table 2) after adjustment for age, sex, and morbidity at baseline. For example, a 10% increase in the time out of range was associated with an increase in the risk of mortality of 29% (odds ratio (OR) 1.29, p < 0.001), an increase of 10% in the risk of an ischaemic stroke (OR 1.15, p = 0.006), and an increase of 12% for all thromboembolic events (OR 1.12, p < 0.001). The risk of an admission for a bleeding related event was also associated with a prior bleeding event and with greater variability in INR values as measured by the standard deviation of the INR readings (OR 1.04, p = 0.017).
DISCUSSION
In the general population, only a minority of patients with NVAF were treated with warfarin, despite its proven efficacy in reducing stroke and other vascular events. There are conflicting guidelines about the use of anticoagulant treatment.14 For many patients—for example, those under 65 years without any other complicating factors such as diabetes, hypertension, or previous cerebrovascular event—warfarin treatment is not considered necessary.15 In addition, there are practical barriers to safe warfarin treatment such as the need for constant monitoring of INR values, individual risk of haemorrhage, and patient preferences.16
Within the group of patients who were routinely monitored with INR readings—assumed to result from warfarin treatment—almost a third of the treatment time and close to half of the raw INR readings were outside the target range. Even so, this result was rather low compared with those found in other published data,17,18 possibly reflecting that the centre where this study took place is a university teaching hospital. Patients treated in other, non-academic settings may not achieve this level of control. The quality of care may also relate to the frequency of testing. The patients in our population had INR tests 23 times a year on average, whereas monitoring rates as high as 13 times within three months and as low as six times over a year have been reported.19,20 The frequency of testing appears to depend on the local model of anticoagulation and, in addition to the quality of control provided, has direct consequences on the cost of AF management.21
The overall figure for the study group also conceals wide variation in the actual time spent in range by any individual patient. The quartile of patients with the poorest control spent, on average, almost three times as long out of range as the group with the best control. Patients were least likely to die or be admitted to hospital when their INR values were near to the midpoint of the target range. Although, in view of the influence of illness and changes in medication, it would be overly simplistic to assume a direct relation between a point INR result and overall outcomes, this may tend to confirm the target range as the optimal level of anticoagulation in NVAF.
Because of the inherent difficulty in maintaining control at the individual level, characterising what we mean by poor control in these patients was in itself difficult from a mathematical perspective. We investigated measurement of poor control through a number of alternative parameters in multivariate analysis, standardising for age, sex, and baseline morbidity. All of the selected measurements were associated with poor outcome.
Even in this group of patients, who at a population level appear to have good control, instability of INR values has significant implications for mortality and other clinical outcomes. We have shown an association between INR values outside the target range and increased rate of hospitalisation. In addition we have shown that a 10% increase in the amount of time out of range is associated with an increase in the likelihood of death of 29.3% and increased the probability of a thromboembolic event by 12.4%, confirming previous findings.1,2 Since INR control was worst during the first three months after the initiation of warfarin and poor control was linked to an increased risk of events, it was likely that patients were at higher risk of events during their first months of treatment while an appropriate dose of warfarin was being established. However, some patients were anticoagulated after an index stroke event, which in itself predicts future stroke events.13 The improvements in time spent in range that occur over time may in part be caused by the withdrawal from treatment of patients who have the greatest difficulty with warfarin treatment, either in control or adverse events.
There were limitations to this study. No data were available describing medication including warfarin or warfarin dosage. Because of this we assumed that only patients who had some degree of continuous monitoring (> 4 INR observations) were treated with warfarin. We were unable to control for confounding factors including other medications and co-morbidities where that information was primarily held in primary care records. The lack of primary care health records also prevented us stratifying patients by their underlying risk of stroke, although it has been calculated that as few as 6% of patients with AF are at low risk of stroke.22 Furthermore, only patients who had an inpatient diagnosis of NVAF were included. Patients with AF diagnosed in primary care could not be identified; therefore, the patients included in the study may have greater morbidity than a sample selected from both the hospital and community. There are also methodological issues when attempting to estimate the proportion of time a patient is within or outside the target INR range.1 The assumption that INR values change in a linear fashion is unlikely to be the case. Values may change sharply soon after a reading has been taken as a result of treatment management or before a reading that has been initiated by a clinical event. As a result extreme values of INR may lead to a bias, as the time spent at either extreme is overestimated. However, the proportion of measurements at these extreme values would be small13 and linear interpolation has been shown to be the simplest and most valid technique compared with other methods.23 Given these limitations, these data describe the care and monitoring of a large cohort of patients, with a very large number of INR values over a lengthy study period.
To conclude, suboptimal anticoagulation was associated with poor clinical outcomes; however, good control is difficult to achieve and maintain. New measures are needed to improve maintenance anticoagulation in patients with NVAF.
APPENDIX 1
Office of Population, Censuses and Surveys (OPCS) codes used to identify the heart valve procedures in the study
APPENDIX 2
International classification of diseases, 10 revision (ICD-10) codes used to identify the serious adverse events in this study
Key summary statistics for the non-valvar atrial fibrillation (AF) study group
Logistic regression models evaluating the relation between post-AF clinical outcomes and anticoagulation control

Percentage of international normalised ratio (INR) readings versus time between consecutive INR readings.
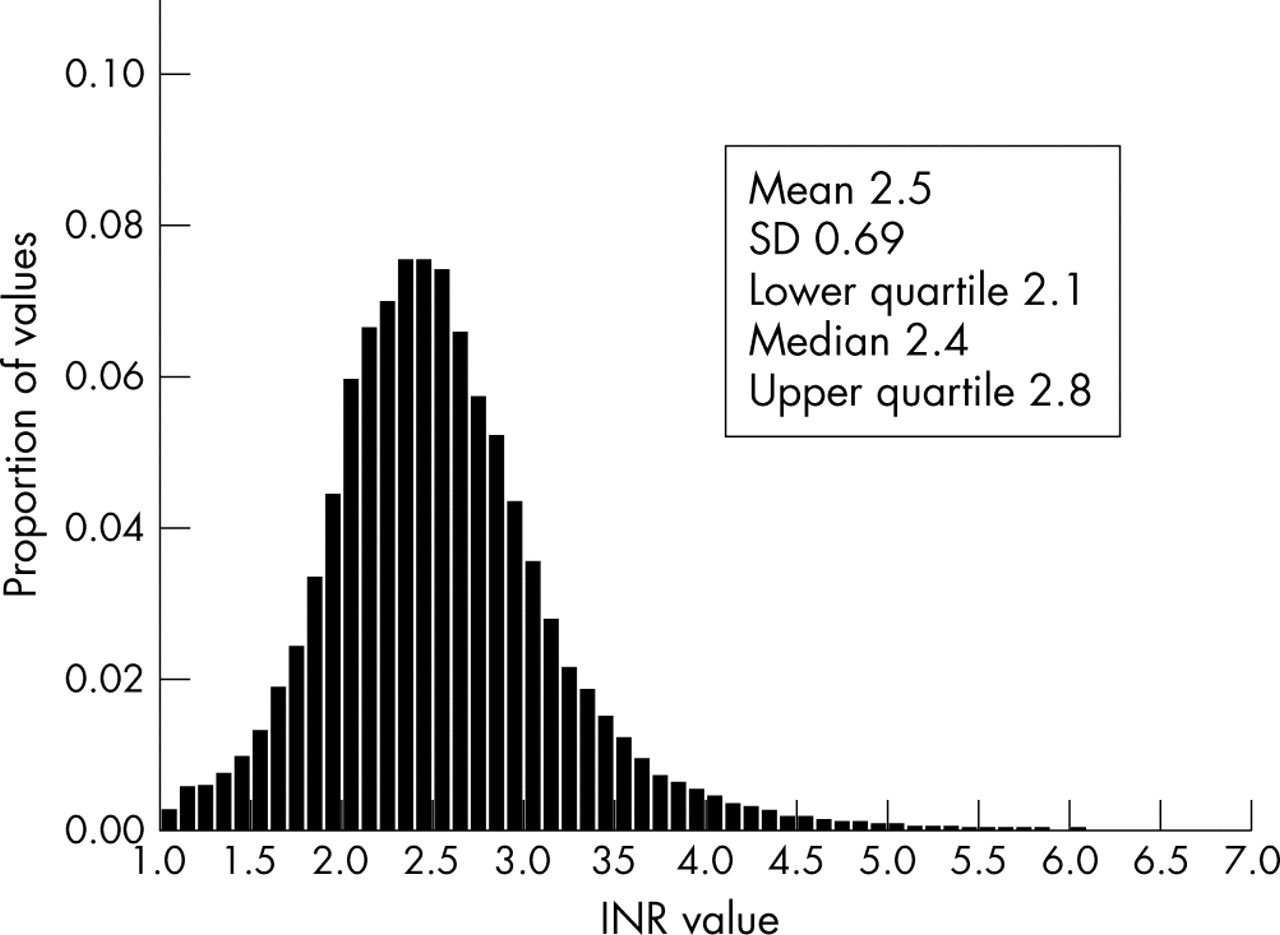
Distribution of interpolated INR values.

Interpolated INR values in target range (2–3) versus time after start of warfarin treatment.

Hospital admission rate as a function of INR level.
Acknowledgments
This study was funded by AstraZeneca UK.
REFERENCES
Footnotes
-
Although all of the authors have academic appointments, this work was commissioned in their university spinout company, Cardiff Research Consortium Limited. CRC undertakes applied research for the pharma industry and has worked for a wide range of companies.