Article Text

Abstract
Objective: To improve equity in cardiovascular disease prevention by developing a cardiovascular risk score including social deprivation and family history.
Design: The ASSIGN score was derived from cardiovascular outcomes in the Scottish Heart Health Extended Cohort (SHHEC). It was tested against the Framingham cardiovascular risk score in the same database.
Setting: Random-sample, risk-factor population surveys across Scotland 1984–87 and North Glasgow 1989, 1992 and 1995.
Participants: 6540 men and 6757 women aged 30–74, initially free of cardiovascular disease, ranked for social deprivation by residence postcode using the Scottish Index of Multiple Deprivation (SIMD) and followed for cardiovascular mortality and morbidity through 2005.
Results: Classic risk factors, including cigarette dosage, plus deprivation and family history but not obesity, were significant factors in constructing ASSIGN scores for each sex. ASSIGN scores, lower on average, correlated closely with Framingham values for 10-year cardiovascular risk. Discrimination of risk in the SHHEC population was significantly, but marginally, improved overall by ASSIGN. However, the social gradient in cardiovascular event rates was inadequately reflected by the Framingham score, leaving a large social disparity in future victims not identified as high risk. ASSIGN classified more people with social deprivation and positive family history as high risk, anticipated more of their events, and abolished this gradient.
Conclusion: Conventional cardiovascular scores fail to target social gradients in disease. By including unattributed risk from deprivation, ASSIGN shifts preventive treatment towards the socially deprived. Family history is valuable not least as an approach to ethnic susceptibility. ASSIGN merits further evaluation for clinical use.
- SHHEC, Scottish Heart Health Extended Cohort
- SIMD, Scottish Index of Multiple Deprivation
- cardiovascular disease
- ethnicity
- prevention
- Scottish Heart Health Extended Cohort
- SHHEC
- socioeconomic status
Statistics from Altmetric.com
- cardiovascular disease
- ethnicity
- prevention
- Scottish Heart Health Extended Cohort
- SHHEC
- socioeconomic status
Numerous policies aim to prevent major diseases and reduce disparities resulting from social deprivation. Two recent studies from Scotland1,2 complement older observations that classic cardiovascular risk factors inadequately explain social variation in disease.3 The second study concluded that using the Framingham risk score for coronary disease4 to assign preventive treatment might lead to relative under-treatment of the socially deprived compared to the socially advantaged in relation to their future disease burden, thus enhancing disparities.2
Accordingly, it was decided to use the nationally representative database for Scotland from this study, the Scottish Heart Health Extended Cohort (SHHEC),5 to develop a cardiovascular risk score, ASSIGN. This, in assessing overall cardiovascular risk, would take account of the risk from deprivation which is independent of conventional risk factors. Additionally, we questioned whether risk factors could be better expressed and whether other risk factors, such as obesity and family history, enhanced the score.
METHODS
Recruitment, risk factor assessment and follow-up
SHHEC includes overlapping studies. The Scottish Heart Health Study5 recruited random samples of men and women aged 40–59 years across 25 districts of Scotland from 1984 to 1987. The Scottish MONICA Project6 recruited in Edinburgh and north Glasgow in 1986, north Glasgow again in 1989 and 1995, ages 25–64 and 1992, ages 25–74. Participants completed a questionnaire for a survey clinic where cardiovascular risk factors were measured following WHO MONICA Project rules.6 Local additions included questions about whether either parent or any siblings had developed heart disease below age 60, and a Minnesota coded electrocardiogram.7
Participants gave permission for follow-up through routine records. They were flagged for death through the National Health Service Register. The Scottish record linkage scheme listed hospital admissions and deaths from 1981 through 2005.8,9
Participants qualified for analysis if they had risk-factor data, permitted follow up, were aged 30–74 years at recruitment and reported neither coronary heart disease nor stroke, and did not have preceding hospital discharge diagnoses of these or transient ischaemic attacks. Endpoints for the ASSIGN score were deaths from cardiovascular causes (ICD-9 codes 390–459, ICD-10 codes I00-I99) or any hospital discharge diagnosis post-recruitment (potentially several per admission) for coronary heart disease (ICD-9 410–414, ICD-10 I20-I25) or cerebrovascular disease (ICD-9 430–438, ICD-10 G45, I60-I69),10,11 or for coronary artery interventions (CABG or PTCA). Time to first episode was taken in measuring disease-free survival.
Social deprivation
We used an index of social status based on postcode of residence at recruitment now replacing the Carstairs deprivation score,12 the Scottish Index of Multiple Deprivation (SIMD). This incorporates numerous components derived from social agencies.13 It ranges from 0.54 (least) to 87.6 (most deprived), and is also divided into fifths of the Scottish population distribution, SIMD1–5.
Statistical methods
Model development
We used continuous risk-factor variables where possible. Ten-year disease-free survival was used for calibrating the ASSIGN score, but full follow-up in developing the risk factor model. The Cox proportional hazards model was used to relate survival from cardiovascular disease to the baseline risk factors.14 For each sex, linearity of effect was shown graphically for the SIMD score, total cholesterol, HDL-cholesterol, systolic blood pressure and cigarettes per day, but not for years since quitting smoking. A significant interaction between sex and SIMD score, persisting after adjustments, suggested separate models for each sex. For each sex, in a multiple regression model, tests proved positive for statistical significance for total cholesterol, HDL-cholesterol, systolic blood pressure, smoking status, cigarettes per day, family history, diabetes, and SIMD score. Body mass index and quitting smoking, both defined in various ways, were not significant in either sex; left ventricular hypertrophy was significant only in women. The final models used the factors identified above as significant in both sexes.
Using the Kaplan-Meier estimate14 of 10-year survival free from cardiovascular disease, the method of Wilson et al15 was used to define the 10-year risk of cardiovascular disease, by sex. The result was named the ASSIGN score: ASSessing cardiovascular risk, using SIGN16 guidelines to assign potential patients to preventive treatment.
Model testing against the Framingham score
The ASSIGN score was compared with the Framingham score for cardiovascular disease. Framingham 10-year cardiovascular risk was defined from the formula given by Anderson et al.4 Observed events were compared with those expected from the Framingham cardiovascular score across fifths of the SHHEC population ranked by SIMD score (as done previously for coronary disease).2 The full ASSIGN score was then compared, within sex, to ASSIGN without deprivation and to the Framingham cardiovascular score using the receiver operator characteristics area under the curve, an overall measure of discrimination.14,17
The agreement between ASSIGN and Framingham was explored by rank correlations, kappa statistics, and by comparing results of similar thresholds for treatment, and equal-sized high-risk groups.
Finally, the contribution of SIMD as a risk factor was assessed in other cardiovascular endpoints used in other Framingham scores.4
For testing in practice, the SHHEC ASSIGN score was incorporated into an EXCEL spreadsheet, along with the Framingham cardiovascular score omitting electrocardiographic left ventricular hypertrophy.
RESULTS
Response rates in the different surveys ranged from 65% to 80%, averaging 72%, and were better in affluent than deprived areas. However, these results included Glasgow MONICA so socially deprived areas are overrepresented in SHHEC. Fewer than 100 participants refused follow-up.
Table 1 gives numbers at risk, and mean values and frequencies for risk factors incorporated into the score, including SIMD score and family history. There were 6540 men and 6757 women; mean age at recruitment was 48.8 years. Follow-up at 30th December 2005 ranged from 10 to 21 years. Of 6540 men, 4936 remained disease free and 1604 developed disease, 743 within 10 years. Of 6757 women, 5742 remained disease free and 1015 developed cardiovascular disease, 422 within 10 years. Risk-factors of 10-year disease victims are also shown.
Means and proportions (SE) of risk factors for the baseline population free of cardiovascular disease, those developing it in the next 10 years, and those placed in the top 20% of the Framingham score, and of the ASSIGN score, by sex (SHHEC age 30–74)
Appendix 1 shows the beta coefficients and formulas used in deriving the ASSIGN score for each sex, with comparable information taken from the cardiovascular risk score for Framingham.4 A working model comparing the scores is available at www.assign-score.com with additional material.
The rank correlations between Framingham cardiovascular and ASSIGN scores were 0.92 for men and 0.90 for women. The expected 10-year cardiovascular incidence overall for men was 14.4% using ASSIGN and 16.0% using Framingham: the observed incidence was 11.7%. However, risk score distributions are highly skewed. The median ASSIGN score in the SHHEC population is the same as the observed incidence, 11.7%. The Framingham median score was 13.6%. In women the expected 10-year cardiovascular incidence overall for women using ASSIGN was 9.3% and using Framingham 9.6%: that observed was 6.4%. The ASSIGN median was 6.2% and Framingham median 7.1%.
Kappa statistics showed good agreement14 between the two scores. For predicting a 10-year risk of 20% or more, kappa (95% CI) was 0.68 (0.66 to 0.70) and of 30%, 0.58 (0.55 to 0.60).
When tested against observed events at a 20% fixed cut-off, the overall success rate (those categorised truly as positive or negative) was 83% for ASSIGN and 79% for Framingham; at 30% cut-off it was 96% and 89%. The ASSIGN score receiver operating characteristic area under the curve14,17 was significantly (but marginally) higher than the Framingham equivalent in both sexes, an advantage lost if SIMD was left out of the score. For men ASSIGN was 0.727 versus Framingham 0.716 (p = 0.02) and for women 0.765 versus 0.741 (p<0.001).
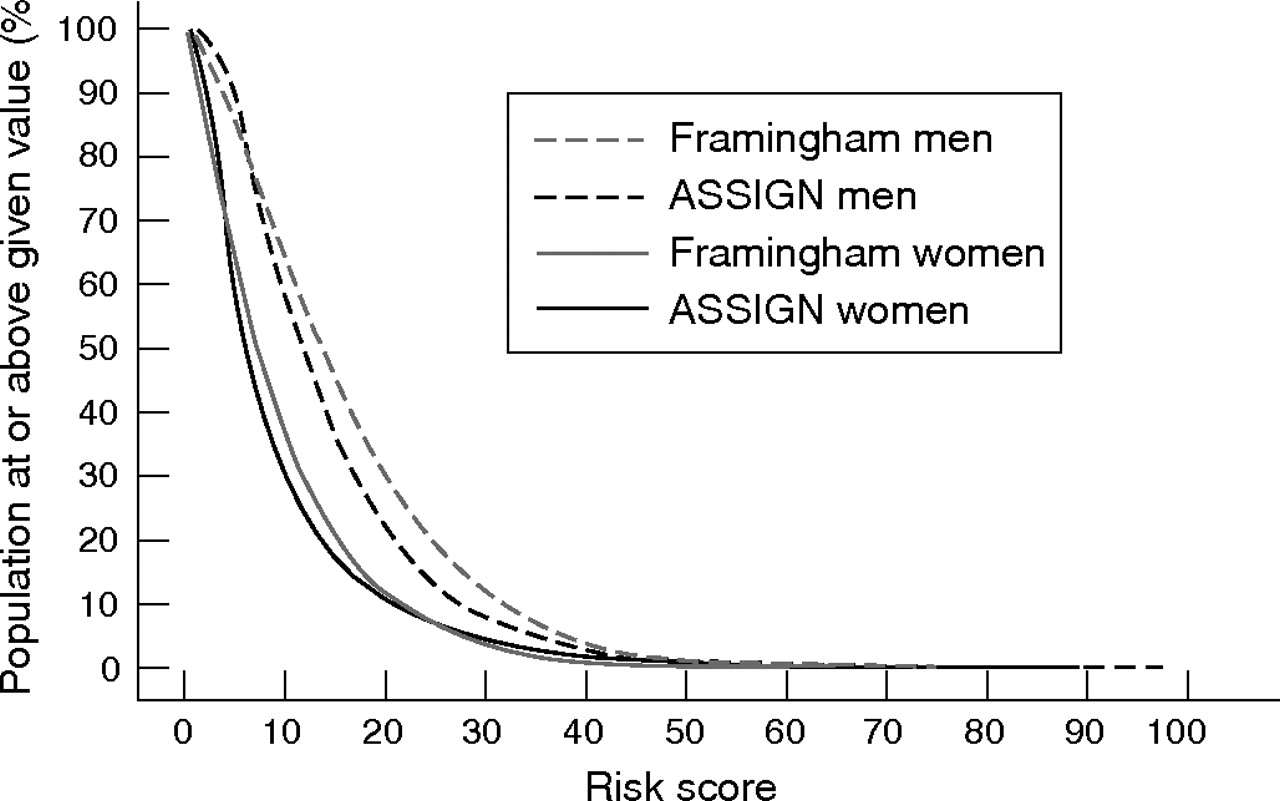
To make comparisons using similar denominators at risk for both scores and both sexes we took the top scoring 20% for each score in each sex as “high-risk”, about the most that could be so considered. Risk-factor values are shown in table 1. Two thirds of those involved are high-risk to both scores; differences are attributable to the remainder. The results by score using the top 20% cutpoint in terms of fifths of the population distribution (in Scotland) of the SIMD, used in our previous paper,2 is shown in table 2. As illustrated in the “how-often-that-high”18 graph of the population frequency distribution of the scores in the SHHEC population (fig 1), the top 20% exceed a Framingham risk score of 24.7% in men and 15.1% in women, and an ASSIGN risk score of 20.8% in men and 13.3% in women. Of the SHHEC events, 46.3% occurred in the top 20% of ASSIGN scores (sexes combined) and 3.4% in the bottom 20%, a ratio of 13.4; for Framingham these values were 45.6%, 4.1% and 11.1.
Performance of the two risk scores by fifths of the Scottish Index of Deprivation, designating the top 20% for each score as “high risk” in each sex, and combining them (SHHEC population age 30–74)

“How-often-that-high” plots for ASSIGN and Framingham cardiovascular disease scores for men and women, aged 30–74 in the SHHEC cohort.
Table 2 shows that with this change of scores there was little change overall in the common indicators used in assessing the performance of screening tests. ASSIGN performs slightly better, as might be expected, within the population from which it was derived. However, within this overall performance, there are significant changes in the proportions of those in different social groups identified as at high risk, and in the numbers and rates of cardiovascular events anticipated or not within this category. ASSIGN compensates the socially deprived for their excess risk where the Framingham score fails to do so.
Similar Cox regression analyses for other cardiovascular endpoints showed the SIMD score to be equally significant as a risk factor for them.
DISCUSSION
We have developed a new cardiovascular risk score, ASSIGN, to mitigate potential unfairness in the Framingham and similar risk scores when applied across different social groups in the same population. Nevertheless, with fewer variables than the ASSIGN score, the overall performance of the Framingham score, tested in the population from which ASSIGN was derived, is very similar. However, table 2 shows that like all other cardiovascular scores, performance in both scores is poor in terms of classical ideals of sensitivity and specificity, resulting in many false positives and false negatives. It might be anticipated that the addition of the extra, individually significant, risk factors to the ASSIGN score would improve overall prediction, but it is a common observation that there are rapidly diminishing returns in adding new factors to cardiovascular risk scores after the first small number. Cardiovascular risk scores are imperfect and resist attempts to perfect them, but they are needed for prioritising allocation of preventive treatment fairly to those at highest risk.
The Framingham score might therefore be preferred to ASSIGN, following the principle of parsimony of risk factors. However, the justification for ASSIGN is not greater discrimination, yet to be shown in other populations, but greater fairness. Its added complexity would be hidden in software for computerised data management in primary care. This would contain look-up tables deriving the deprivation score from the postcode of residence of the individuals concerned, as well as consulting or requesting risk factor values, including cigarette consumption and family history. Because we have used continuous variables where possible, this score is more appropriate to electronic calculation than to the colour charts which use risk factor categories. The readout is the same: 10-year risk of cardiovascular disease in the disease free, although again a continuous score rather than a category.
Our earlier analyses in the SHHEC population,2 like others, suggested that the Framingham coronary risk score overestimated risk. Based on observed/expected event rate ratios, it failed to compensate for social deprivation across SIMD fifths of the population, overestimating risk least in the socially deprived. These findings are repeated here for cardiovascular disease (table 2) with similar results and ratios but larger numbers of events. Social deprivation or socioeconomic status is not only a powerful determinant of coronary and cardiovascular risk but also of chances of reaching hospital alive in a coronary event.19
For these analyses we used mean Framingham score in the population group concerned to calculate “expected” event rates. After deriving the ASSIGN score, calibrated to 10-year risk in the SHHEC population, we found that it too appeared to overestimate mean risk when it should not have done. We realised then that this paradox was explained by the skewed distribution of risk factor scores. Although the Framingham score does read too high in our population, and it does read higher than ASSIGN, the degree of overestimation is exaggerated using means (see fig 1 and table 2). What happens at the chosen high cutpoints is what matters in practice. This paradox was previously missed both by us and by others. It needs further exploration and discussion elsewhere.
Table 2 shows, using the Framingham score, an undesirable and significant social gradient both in observed/expected ratios, and in the event rate for unanticipated cardiovascular events by SIMD fifth, when using a convenient but artificial criterion for high risk in men and women of the top 20% of risk. These gradients are abolished by the ASSIGN score which redistributes high risk, and potential preventive treatment, towards the most deprived. In its own parent population it has therefore succeeded in its primary objective of social equity. But it needs testing elsewhere.
Apart from social deprivation, the ASSIGN score incorporates a quantitative measure of cigarette smoking where in Framingham it is yes or no.4,15 Attempts to characterise ex-smokers were less successful. We recommend classifying them as smokers for the first year and then as non-smokers.
Our third difference from Framingham is the use of family history. The original survey question was about heart disease in parents or siblings below the age of 60. Because younger people may not have parents or siblings who have reached 60, the question has been modified for future use to include premature stroke, and a positive history in several relatives such as uncles, aunts or cousins (see appendix 2). Apart from other advantages of incorporating family history, it may help with ethnic susceptibility. The SHHEC cohort was insufficiently heterogeneous to study risk in ethnic subgroups, but a positive family history was common. Susceptible groups, such as South Asians, could identify their risk through their family’s medical history. A non-threatening question, it avoids labelling people where there could be sensitivity or confusion on the part of the questioner or the questioned. We suspect family history replaced some of the risk associated with social deprivation since they are associated.
We were unable to find a simple adjustment to Framingham scores for social deprivation to make them similar to those from ASSIGN. They read higher on average, and dose of cigarettes and family history complicate a simple one-factor change.
Our comparisons have given us considerable respect for the Framingham score whose coefficients for classic risk factors appear robust.20,21 Whether ASSIGN’s marginally better discrimination and its coefficients for deprivation and family history apply elsewhere awaits further testing. Further comparisons will evaluate ASSIGN against Framingham with different cutpoints, age and sex and social distributions, both in other historical populations with equivalent follow-up data, but also in modern populations such as the Scottish Health Survey22 to assess potential workload and economic consequences of its adoption. It needs installing into computerised databases for pilot testing in primary care.
Whether or not it performs marginally better than the Framingham score overall, ASSIGN addresses the issues of social deprivation and family history. Through greater fairness to disadvantaged, high-risk, minority groups in the population, it should appeal to clinicians and to those responsible for health service strategy.
Acknowledgments
We acknowledge the thousands of volunteer participants who donated their time, their risk factor data and their follow-up data to make this study possible, the work of the NHS Central Register Edinburgh for mortality data, and Information Services of NHS National Services Scotland for morbidity data.
REFERENCES
Supplementary materials
Files in this Data Supplement:
Footnotes
-
Published Online First 7 November 2006
-
Funding: Scottish Executive Health Department for this analysis. The Cardiovascular Epidemiology Unit and its studies were funded by a British Heart Foundation Programme grant from 1995 to late 2005, and before that by the Chief Scientist Office of the Scottish Home and Health Department. The opinions expressed in this paper are those of the authors and not the funding bodies.
-
Competing interests: None declared.
-
MW planned the analysis of the database, developed the risk score and carried out its critical evaluation, contributing appropriately to the manuscript. PB contributed to the design concept and made critical contributions to the development of the score and the manuscript. HTP planned the study in consultation with the SIGN risk estimation group, obtained the funding, managed and updated the database with staff of the Dundee Unit, is guarantor of the data, assisted in planning the score and in its evaluation, and wrote the paper.
-
Members of the SIGN (Scottish Intercollegiate Guidelines Network, 28 Thistle Street, Edinburgh EH2 1EN) risk estimation group who helped to refine the study proposal and analyses were: Dr James Grant (chair, principal in general practice, Auchterarder), Dr Moray Nairn (secretary, SIGN Edinburgh), Dr Adrian Brady (consultant cardiologist, Glasgow), Dr Peter Brindle (research and development strategy lead and honorary research fellow, Bristol Teaching Primary Care Trust and Department of Social Medicine, University of Bristol), Mrs Joyce Craig (senior health economist, NHS Quality Improvement Scotland), Dr Alex McConnachie (statistician, Robertson Institute, Glasgow), Mr Adam Redpath (Programme Principal, Information Services, NHS National Services Scotland, Edinburgh), Mr Roger Stableford (patient representative, Falkirk), Professor Hugh Tunstall-Pedoe (cardiovascular epidemiologist, Dundee) and Professor Graham Watt (general practice, Glasgow).
-
Ethical approval was received from all relevant medical research ethics committees covering the individual populations involved.