Article Text

Abstract
Objectives: To determine the usefulness of new two-dimensional strain indices, based on speckle tracking imaging, for assessment of systemic right ventricular (RV) function after an atrial switch operation for transposition of the great arteries.
Design: Cross-sectional study.
Setting: Tertiary paediatric cardiac centre.
Methods: 26 patients, mean (SD) age 21.0 (3.6) years at 19.9 (3.2) years after an atrial switch operation, and 27 age-matched controls were studied. Two-dimensional imaging at the four-chamber view was obtained with tracing of the entire RV endocardial border. The RV global longitudinal strain (GLS) and GLS rate were derived using automated software (EchoPAC, GE Medical) and correlated with tissue Doppler-derived RV isovolumic acceleration (IVA), and, in the patient cohort, with cardiac magnetic resonance-derived RV ejection fraction.
Results: Intra- and interobserver variability for measurement of GLS, as determined from the mean (SD) of differences in two consecutive results from 20 studies, were 0.06 (1.39)% and 0.24 (1.77)%, respectively. Compared with controls, patients had lower RV GLS (17.1 (1.9)% vs 26.3 (2.9)%, p<0.001), a reduced GLS rate (0.78 (0.11)/s vs 1.33 (0.23)/s, p<0.001), lower RV IVA (1.10 (0.36) m/s2 vs 1.56 (0.53) m/s2, p<0.001) and increased RV myocardial performance index (0.52 (0.09) vs 0.38 (0.09), p<0.001). Both RV GLS and GLS rate correlated positively with RV IVA (r = 0.43, p = 0.001 and r = 0.46, p<0.001, respectively), and negatively with RV myocardial performance index (r = −0.65, p<0.001 and r = −0.57, p<0.001, respectively). In patients, the GLS rate correlated positively with RV ejection fraction (r = 0.62, p = 0.001).
Conclusions: Two-dimensional RV GLS and GLS rate are new, potentially useful indices for assessment of systemic RV function.
Statistics from Altmetric.com
Late systolic dysfunction of the systemic right ventricle in patients with complete transposition of the great arteries (TGA) after a Mustard or Senning procedure is well documented.1–5 Serial monitoring of systemic right ventricular (RV) function is warranted for timely interventions. Nonetheless, given the complex geometry of the right ventricle, assessment of its function is inherently difficult. Increasing data suggest that measures of myocardial deformation during systole, systolic strain and strain rate are strong indices of ventricular contractility.6–9 The traditional method of deriving regional systolic strain and strain rate from tissue Doppler imaging is, however, limited by angle dependency. On the other hand, the recently introduced approach based on speckle tracking allows angle-independent assessment of both regional and global systolic strain and global strain rate from two-dimensional echocardiographic images.10 11 The speckle tracking method has been used to assess subpulmonary RV function in patients with pulmonary arterial hypertension.12 13 In this study we determined the usefulness of this technique in the assessment of regional and global systemic RV function in patients after atrial switch operation for TGA.
PATIENTS AND METHODS
Subjects
Twenty-six patients (17 male) aged 21.0 (3.6) years with complete TGA who had undergone an atrial switch operation and 27 age-matched healthy controls (19.0 (4.1) years) were studied. The following patient data were collected: associated ventricular septal defect (VSD) and other intracardiac abnormalities, age at and type of reparative surgery, duration of follow-up since operation and New York Heart Association (NYHA) functional class. Patients not having a sinus rhythm were excluded. The institutional ethics committee approved the study and all of the subjects gave informed consent.
Echocardiographic assessment
Transthoracic echocardiography was performed using the Vivid 7 ultrasound system (General Electric Vingmed Ultrasound, Horten, Norway). Conventional colour Doppler imaging was used to grade the severity of tricuspid valve regurgitation semiquantitatively by assessing the ratio of tricuspid regurgitation jet area to the right atrial area.14
Two-dimensional images were acquired from the four-chamber view for offline analysis using the two-dimensional strain software (EchoPAC, General Electric Vingmed Ultrasound), as described previously.10 The software is based on real-time tracking of natural acoustic markers, which allows the derivation of two-dimensional strain and strain rate by comparing displacement of speckles in relation to one another throughout the cardiac cycle. To determine the RV longitudinal strain and strain rate, the endocardial border of the right ventricle was traced manually and tracked by the software (fig 1). The RV free wall and interventricular septum were divided in three segments, basal, mid, and apical, for quantification of regional systolic strain. The global longitudinal systolic strain (GLS) and strain rate (GLS rate) were calculated for the entire traced contour of the right ventricle.

Pulsed tissue Doppler echocardiography at the apical four-chamber view was performed with the sample volume positioned at the RV free wall–tricuspid annular junction. The tissue Doppler-based myocardial performance index of the right ventricle was calculated according to the formula: (a−b)/b, where “a” represents the time interval between the end and onset of atrioventricular valve annular diastolic velocities, and “b” is the duration of annular systolic velocity.15
Colour-coded tissue Doppler imaging was obtained from the apical four-chamber view with frame rates exceeding 100 Hz. The colour-coded myocardial velocities were recorded at the base of the RV free wall below the insertion of the tricuspid valve leaflets. The myocardial acceleration during isovolumic contraction was calculated as the difference between peak and baseline myocardial velocities divided by the time interval from onset of the wave during isovolumic contraction at zero crossing to the time at peak velocity.16
All echocardiographic recordings were stored on digital versatile discs for offline analyses. Measurements were made in three cardiac cycles, and the average was used for statistical analyses.
Cardiac magnetic resonance imaging
Twenty-five patients underwent cardiac magnetic resonance imaging for measurement of RV systolic volume, end-diastolic volume and ejection fraction. The examination was performed using a 1.5 T superconducting whole-body imager (GE Signa Horizon Echospeed, General Electric Medical Systems, Milwaukee, Wisconsin, USA) with a phase-array torso coil. ECG-triggered fast spin-echo double inversion recovery axial procedure (TR/TE, auto/42) was performed for baseline image. Analysis of RV and left ventricular function was obtained by fastcard-SPGR cine on axial and short-axis planes, respectively. Analysis of ventricular function was performed by using the software in Advantage Window version 4.2.
Statistical analysis
Data are presented as mean (SD). The absolute values of systolic strain and strain rate were used for analysis to facilitate presentation and interpretation. The intra- and interobserver variabilities for measurement of GLS were determined from differences in two consecutive readings from 20 studies. The reproducibility of two-dimensional strain assessment was further determined by Bland–Altman analysis of the intra- and interobserver data.17 Differences in demographic and echocardiographic variables between patients and controls were compared using unpaired Student’s t test. For the whole cohort, Pearson correlation analysis was used to assess the relations between RV GLS and GLS rate and other echocardiographic indices of RV function. Within the patient cohort, Pearson correlation analysis was also used to assess the relations between RV GLS and GLS rate and magnetic resonance-derived RV volumes and ejection fraction. A two-tailed p value <0.05 was considered significant. All statistical analyses were performed using SPSS 11.0 (SPSS, Chicago, Illinois, USA).
RESULTS
Subjects
Of the 26 patients, 20 had undergone the Senning operation and six the Mustard procedure. They were studied at 19.9 (3.2) years after the operation. Five patients had an associated ventricular septal defect that was closed at the time of the atrial switch operation without residual leak. Twenty-two were in NYHA functional class I, while the remaining patients were in class II. Moderate-to-severe tricuspid regurgitation was present in six patients.
Observer variability
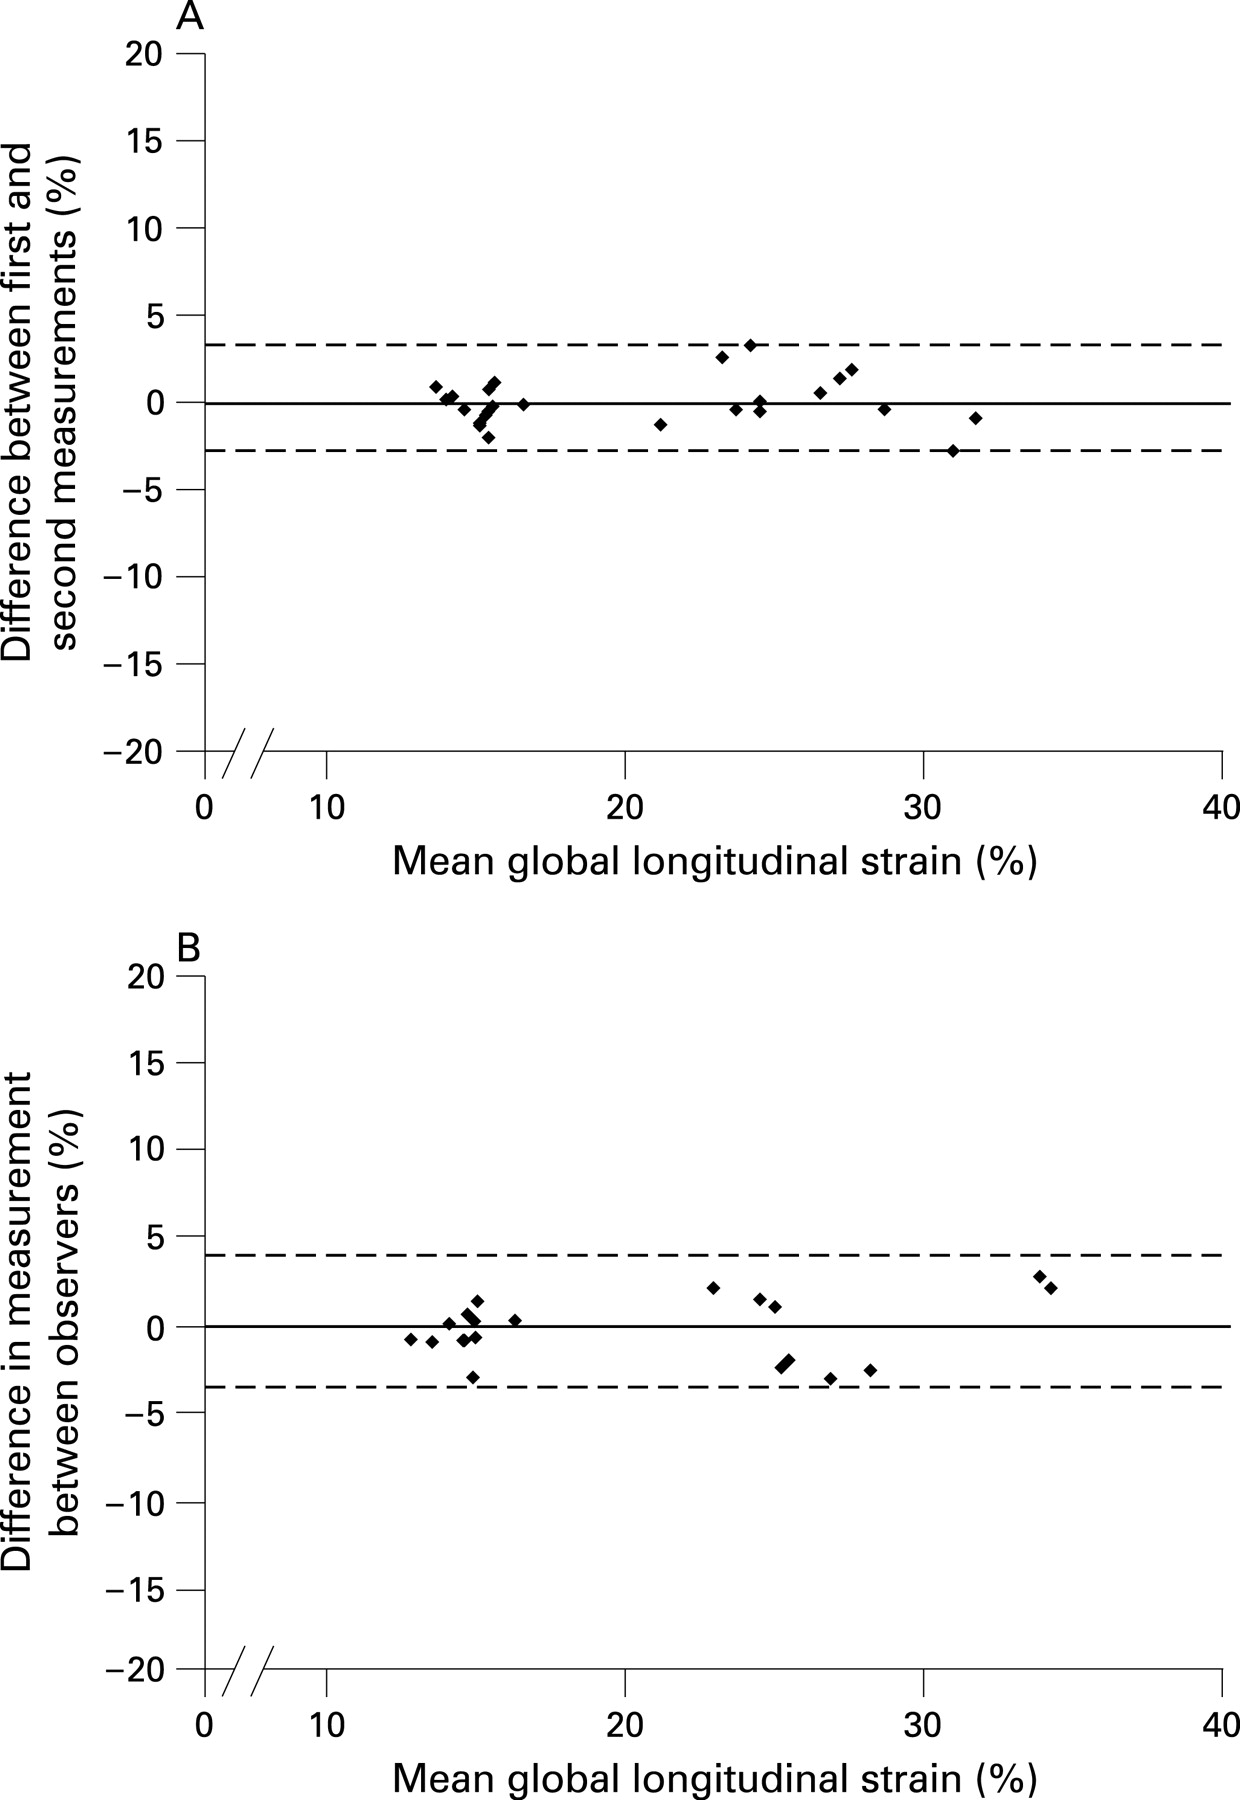
The intra- and interobserver variabilities for measurement of GLS as determined from the mean (SD) differences in two consecutive readings from 20 studies were 0.06 (1.39)% and 0.24 (1.77)%, respectively. Bland–Altman analysis further showed no tendency for the difference between two consecutive readings to vary with the magnitude of the mean RV GLS (fig 2).
Systemic RV function
Compared with controls, the segmental systolic strain of the RV free wall and ventricular septum were all significantly lower (all p<0.05) (table 1). Similarly, the GLS (17.1 (1.9)% vs 26.3 (2.9)%, p<0.001) and GLS rate (0.78 (0.11)/s vs 1.33 (0.23)/s, p<0.001) were significantly lower in patients than controls. Figure 1 shows representative strain and strain rate analyses of two-dimensional images. The worse systemic RV function in patients, as compared with controls, was further suggested by the greater RV myocardial performance index (0.52 (0.09) vs 0.38 (0.09), p<0.001) and the lower RV IVA (1.10 (0.36) m/s2 vs 1.56 (0.53) m/s2, p<0.001). The lower IVA in patients was related to a lower peak myocardial systolic velocity at isovolumic contraction (4.35 (1.49) cm/s vs 5.34 (1.79) cm/s, p = 0.03) and a longer duration to reach the isovolumic peak systolic velocity (40.3 (9.9) ms vs 35.5 (8.6) ms, p = 0.07).
Compared with the 21 patients who did not have a VSD, the five patients who required additional VSD repair had significantly lower RV GLS (15.2 (0.6)% vs 17.6 (1.8)%, p = 0.007) and their RV GLS rate also tended to be lower (0.70 (0.11)/s vs 0.80 (0.11)/s, p = 0.07). By contrast, the RV IVA (p = 0.12) and myocardial performance index (p = 0.49) did not differ between these two patient subgroups.
The six patients with significant tricuspid regurgitation had significantly larger RV end-diastolic volume (133 (30) ml vs 95 (24) ml, p = 0.004), but similar RV ejection fraction (0.46), RV GLS (p = 0.27) and RV GLS rate (p = 0.68), than those without significant regurgitation.
Correlation between two-dimensional strain and other measures of RV contractility
The RV GLS correlated significantly with the GLS rate (r = 0.91, p<0.001). RV GLS correlated positively with IVA (r = 0.43, p<0.001) and negatively with myocardial performance index (r = −0.65, p<0.001). Similarly, the RV GLS rate also showed positive correlation with IVA (r = 0.46, p<0.001) and negatively with myocardial performance index (r = −0.57, p<0.001).
The cardiac magnetic resonance findings in the 25 patients were as follows: RV end-diastolic volume 104 (30) ml, RV end-systolic volume 54 (21) ml and RV ejection fraction 49 (8)%. For the whole patient cohort, RV GLS rate correlated significantly with RV ejection fraction (r = 0.62, p = 0.001) (fig 3). The correlation between RV GLS and ejection fraction was, however, weaker (r = 0.35, p = 0.087).

DISCUSSION
This study demonstrates that two-dimensional systolic strain and strain rate are useful indices for assessment of systemic RV systolic function. Although cardiac magnetic resonance has been regarded as the preferred method for determination of RV volumes and ejection fraction, this modality is limited by cost and availability, and deemed unsuitable for patients with implanted cardiac pacemakers. The Doppler-derived myocardial performance index, shown to correlate RV ejection fraction in patients after atrial switch operation,18 is regarded as an index of combined systolic and diastolic function.19 On the other hand, IVA has been validated as a relatively load-independent index of subpulmonary and systemic RV contractility.16 20 21 However, optimal alignment of Doppler interrogation can be difficult and regional variation in contractility is not reflected by this index. The presence of coexisting RV wall motion abnormalities, demonstrated in patients after an atrial switch operation,20 22 may potentially confound the interpretation of IVA. The ability to track the whole RV contour by the automated two-dimensional speckle tracking method may be advantageous in this regard.
Evidence is accumulating to suggest that systolic strain and strain rate are strong indices of ventricular contractility.6–9 Two-dimensional strain analysis is probably better than tissue Doppler strain echocardiography given its angle independence and good spatial resolution.11 Furthermore, global parameters are probably less sensitive to local noise, which has been a problem with tissue Doppler-derived strain and strain rate.10 11 Indeed, studies have demonstrated sensitivity and specificity of the speckle tracking technique in the detection of left ventricular dysfunction in adults after myocardial infarction10 11 and in those with hypertrophic cardiomyopathy.23 Recently, this technique has also been used to assess subpulmonary RV function in patients with pulmonary hypertension.12 13 Our study further confirms the reproducibility of two-dimensional strain analysis in assessment of global RV function.
Our findings of reduced regional RV longitudinal strain and strain rate in patients after atrial switch operation agree with previous studies that used tissue Doppler echocardiography for strain analysis.24–26 Nonetheless, the noisy Doppler-derived strain and strain rate curves and the difficulty of optimal alignment of Doppler interrogation raise concerns. To our knowledge, this study is the first to assess GLS and GLS rate of the systemic right ventricle using two-dimensional strain echocardiography. We found that the relation between RV ejection fraction and RV GLS rate is greater than that with GLS. As the peak systolic strain rate represents the rate of myocardial deformation, it might better reflect the rate of myocardial force generation and hence contractility. Indeed, systolic strain rate has been shown to correlate better with invasive measurements of left ventricular contractility than strain.7 27 It would be of further interest to determine the correlation between RV strain indices and the extent of myocardial fibrosis, as assessed by late gadolinium enhancement, reported in these patients.28
While reduced RV free wall and septal strain may reflect an adaptive response to the systemic load, the concurrent findings of reduced global RV longitudinal strain rate, decreased RV IVA and increased RV myocardial performance index provide evidence of systemic RV myocardial dysfunction, albeit subclinical in the majority of our patients. Indeed, incipient myocardial dysfunction has also been suggested by Pettersen and colleagues, who recently demonstrated the absence of RV torsion in these patients.26 In our study, however, we did not assess RV twisting or myocardial deformation in its circumferential and radial directions.
The reproducibility, the minimal noise of the two-dimensional strain and strain rate curves (fig 1), and the global nature of these parameters may be advantageous for serial monitoring of systemic ventricular function in patients after atrial switch operation. From a practical point of view, the acquisition of two-dimensional images from the four-chamber view is standard and the data could either be stored in digital versatile disc form or transferred directly to the workstation for offline analyses. In the presence of good-quality two-dimensional images, manual tracing of the RV endocardial border and automatic tracking of acoustic markers can easily be achieved. In our experience, data acquisition and strain analysis for the three cardiac cycles can usually be accomplished with 15 minutes. The use of this new technique for assessment of ventricular–ventricular interaction in this patient cohort would be a topic for further research.
Several limitations in this study warrant comment. First, we did not perform invasive measurements to determine the end-systolic pressure–volume relationship, a relatively load-independent index of RV contractility. Nonetheless, we did correlate the strain indices with RV IVA, which has previously been shown to be a relatively load-independent index of RV contractility.16 Second, the potential load dependency of two-dimensional strain and strain rate is not explored. It is interesting to note, however, that a recent study showed that transcatheter closure of atrial septal defect in children is not associated with changes of mid-segmental strain and strain rate of the RV free wall and septum.29 In a group of healthy adults, the absence of changes in subpulmonary RV systolic strain and peak systolic strain rate to moderate increase preload and afterload has also been demonstrated.21 Nonetheless, the influence of a loss of sinus rhythm on strain and strain rate after atrial switch may be more significant given the importance of atrioventricular transport in the presence of abnormal intra-atrial pathways.30 Third, it would have been ideal to stratify the patients by the presence or absence of associated VSD, but at the expense of reducing the power of the study.
In conclusion, GLS and GLS rate, as determined by two-dimensional speckle tracking echocardiography, are reproducible indices that are potentially useful for serial monitoring of systemic RV function in patients after atrial switch operation. Further studies with a larger cohort of patients are required to confirm our preliminary findings. Longitudinal studies to determine how well these indices track the changes in cardiac magnetic resonance-derived RV ejection fraction and the value of these indices in predicting the changes in RV function are undoubtedly warranted.
REFERENCES
Footnotes
Competing interests: None.
X-CL is a research fellow from Children’s Hospital of Fudan University, Shanghai, China.
Ethics approval: The institutional ethics committee approved the study.