Article Text

Abstract
To compare the discriminative performance of the PURSUIT, GUSTO-1, GRACE, SRI and EMMACE risk models, assess their performance among risk supergroups and evaluate the EMMACE risk model over the wider spectrum of acute coronary syndrome (ACS).
Design: Observational study of a national registry.
Setting: All acute hospitals in England and Wales.
Patients: 100 686 cases of ACS between 2003 and 2005.
Main outcome measures: Model performance (C-index) in predicting the likelihood of death over the time period for which they were designed. The C-index, or area under the receiver-operating curve, range 0–1, is a measure of the discriminative performance of a model.
Results: The C-indexes were: PURSUIT C-index 0.79 (95% confidence interval 0.78 to 0.80); GUSTO-1 0.80 (0.79 to 0.81); GRACE in-hospital 0.80 (0.80 to 0.81); GRACE 6-month 0.80 (0.79 to 0.80); SRI 0.79 (0.78 to 0.80); and EMMACE 0.78 (0.77 to 0.78). EMMACE maintained its ability to discriminate 30-day mortality throughout different ACS diagnoses. Recalibration of the model offered no notable improvement in performance over the original risk equation. For all models the discriminative performance was reduced in patients with diabetes, chronic renal failure or angina.
Conclusion: The five ACS risk models maintained their discriminative performance in a large unselected English and Welsh ACS population, but performed less well in higher-risk supergroups. Simpler risk models had comparable performance to more complex risk models. The EMMACE risk score performed well across the wider spectrum of ACS diagnoses.
Statistics from Altmetric.com
Accurate risk assessment is important in the management of patients presenting with acute coronary syndromes (ACS): guiding discussions regarding prognosis with individual patients and their relatives, allowing “case-mix” adjustments during comparisons of hospital performance and helping medical decision-making. Early risk stratification is essential, as the benefits of more aggressive and costly treatments are seen mainly in those at higher risk of adverse clinical events.1–4 Over the past few years, a systematic approach to risk assessment has been proposed, and several risk scores including the Platelet glycoprotein IIb/IIa in Unstable angina: Receptor Suppression Using Integrilin Therapy (PURSUIT),5 Global Utilization of Streptokinase and TPA for Occluded coronary arteries (GUSTO),6 Global Registry of Acute Coronary Events (GRACE),7–9 Simple Risk Index (SRI)10 and the Evaluation of the Methods and Management of Acute Coronary Events (EMMACE)11 have been developed. Although these risk scores have been externally validated, the performance of most outside clinical trials has not been assessed in the UK population. In fact, while some models have been validated in remote populations,12–17 the utility of others has been questioned.18–20 Furthermore, it has been suggested that more data-rich risk scores provide better discrimination for mortality than simpler systems, while others argue that secondary abstraction of difficult-to-obtain key clinical findings adds little to the predictive power of risk-adjustment scores.21
Using the Myocardial Infarction National Audit Project database (MINAP), an extensive community-based cohort of patients hospitalised with ACS, we aimed to (i) compare the discriminative performance of five established ACS risk models (PURSUIT, GUSTO-1, GRACE, SRI and EMMACE) in predicting the likelihood of death over the time period for which they were designed, (ii) assess their performance among risk supergroups and (iii) further evaluate the EMMACE risk model over the wider spectrum of ACS.
METHODS
The MINAP database
Details of MINAP have previously been published.22–24 MINAP covers all acute hospitals in England and Wales (n = 229). Data are collected prospectively at each hospital, electronically encrypted and transferred online to a central database.25 There is the facility for contemporary analysis and dissemination. By means of 108 data fields, each patient entry offers details of the patient journey, including the method and timing of admission, inpatient investigations, results and treatment, and (if applicable) date of death (from linkage to the Office for National Statistics using a unique National Health Service number). Data entry is subject to routine online error checking. There is a mandatory annual data validation exercise for each hospital involving the completion of data entry for 20 fields from 20 sets of randomly generated records for patients whose data had been previously entered.
Statistics
We studied all patients in England and Wales who were admitted to hospital with ACS and who were entered into the MINAP database between 1 January 2003 and 31 March 2005. We only analysed data for the first recorded (index) hospital admission for each patient. We selected patients between the ages of 18 years and 100 years who presented with an admission systolic blood pressure (SBP) between 49 mm Hg and 250 mm Hg and heart rate (HR) between 20 bpm and 200 bpm.
Continuous data were expressed as means (SD) or as median and interquartile ranges for skewed distributions. Discrete or categorical data were summarised using frequencies and percentages. The independent t test was used for comparison of normally distributed data; otherwise non-parametric alternatives were used. Associations between various mortality outcomes and potential predictive factors were quantified by odds ratios (ORs) with 95% confidence intervals (CI) and p values. We used SPSS version 12 to undertake basic statistical summaries and classic logistic modelling of clinical end points appropriate to each risk model.
Risk model evaluation
We used the scoring system described by the respective ACS models and did not use the coefficients derived from the original risk scores. Each risk score was applied to the category of ACS patients, and over the length of time for which it was designed. The performance of the risk models was evaluated using the area under the receiver-operating curve (ROC), otherwise known as the C-index.26 We validated the risk scores against the MINAP dataset and compared the C-indexes with those published in the original studies. If they were as high as the value obtained from the derivation population they were considered to have good validation.27 For all studies the discriminative performance was assessed within the groups of patients with previous diagnoses of diabetes mellitus, chronic renal failure (creatinine consistently above 200 μmol/l) and/or angina. (Other variables indicative of higher risk, such as age and heart failure were not selected because they were included in some of the risk scores and would have biased the within-group analyses.) For the EMMACE risk score, we used the contemporary data from the MINAP database to recalibrate the model of age, SBP and HR and also evaluated its discriminative performance over a spectrum of different ACS diagnoses.
Risk models
The PURSUIT risk model
This score predicts 30-day death and the composite of death or AMI in ACS patients without persistent ST-segment elevation.5 The most important predictor variables reported were (older) age, (higher) admission HR, (lower) SBP, ST-segment depression, signs or history of heart failure and elevation of cardiac biomarkers.
The GUSTO-1 risk model
This model predicts one-year survival in 30-day survivors of ST-elevation myocardial infarction (STEMI).6 Reported predictor variables included (older) age, (lower) weight, Killip class, admission (lower) blood pressure, admission (higher) HR, QRS duration (mm), smoking, history of hypertension, history of cerebrovascular disease and arrhythmia on admission.
The GRACE risk score
This registry included patients with ACS with and without STEMI and predicts all-cause in-hospital and six-month death. Its components were (older) age, admission (higher) HR, admission (lower) SBP, history of heart failure, cardiac arrest during presentation, ST-segment deviation on the presenting electrocardiogram, (elevated) serum creatinine and (elevated) cardiac markers.7–9 We had no data on cardiac arrest.
The Simple Risk Index
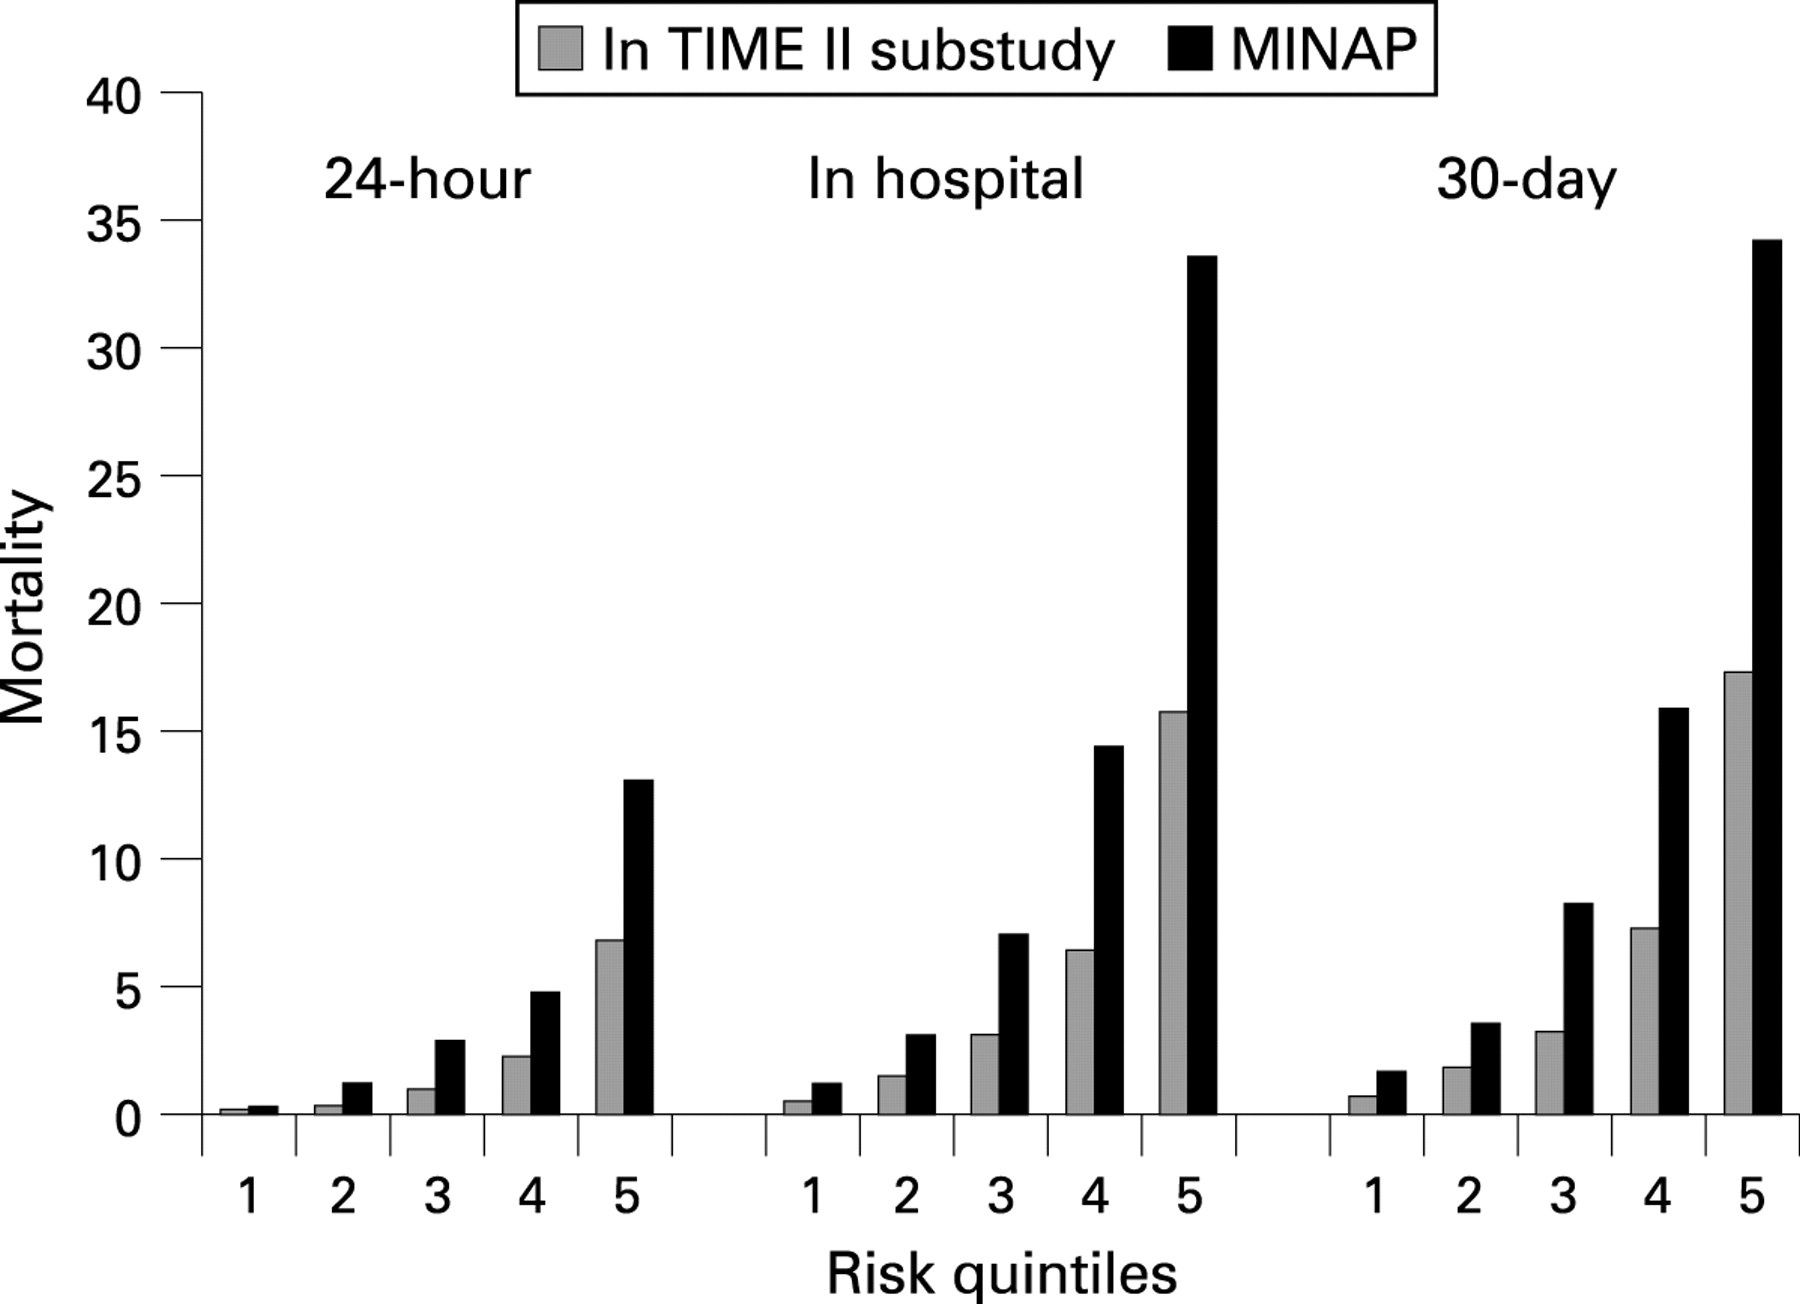
This score uses admission age, SBP and HR to predict 30-day mortality in patients (in the InTIME II trial) presenting with STEMI.10 It uses the following equation: HR × [age/10]2/SBP.
The EMMACE risk model
The EMMACE risk model also uses age, SBP and HR on admission to predict 30-day mortality, but was derived from an English community-based cohort of patients with STEMI.11 Mortality risk is described by an alternative equation: 1/(1 + exp(−L(30))), where L30 − 5.624 + ((0.085 × age) + (0.014 × HR) – (0.022 × SBP)).
RESULTS
MINAP data
In total we had data for 104 988 index admissions; 4302 did not meet the inclusion criteria for analysis. The median length of follow-up was 261 days (interquartile range 121–413 days, maximum 791 days). There were 34 986 (34.7%) patients with STEMI, 42 582 (42.3%) with non-ST elevation myocardial infarction (NSTEMI), 7369 (7.3%) with troponin-negative ACS, 3816 (3.8%) with chest pains of uncertain origin, 523 (0.5%) with unconfirmed myocardial infarction and 7051 (7.0%) others (who did not conform to any one of these categories). Over a third of patients (30 225, 35.2%) received thrombolytic therapy while 2998 (3.0%) presented with an SBP<90 mm Hg.
Of the 100 686 patients, 64 139 (63.9%) were male. The mean (SD) age, SBP and HR were 68.9 years (13.8 years), 141.2 mm Hg (29.6 mm Hg) and 81.8 bpm (24.1 bpm). The median time to death (n = 14 611) was 18 days after admission, with an earlier median time to death (7 days) among patients with STEMI than among patients with NSTEMI (32 days), troponin-negative ACS (149 days) and chest pain of uncertain cause (82 days). Nearly 20% (19.8%) of all deaths occurred within 24 hours of hospital admission. Two-thirds (55 747 (66.0%)) of the total MINAP study population, were discharged on a β-blocker, 57 496 (68.0%) an ACE inhibitor; 68 938 (81.6%) a statin and 73 731 (86.3%) were given aspirin. Demographic characteristics, medical history and presenting clinical features are shown in table 1 for patients who died and for the overall population as the reference.
Risk model performances
The PURSUIT risk model
For the 49 995 patients suitable for analysis, we found age, SBP, HR, heart failure, elevated cardiac markers and ST-segment depression to be independent predictors (table 2). The final model was a good discriminator of 30-day mortality (C-index 0.79, 95% CI 0.78 to 0.80, p<0.001). The published PURSUIT mortality rate at 30 days was 3.6% compared to our 30-day rate of 8.9% for patients with the same diagnosis and the C-index from the derivation cohort was 0.81.5
The GUSTO-1 risk model
The mortality rate for our population of 26 238 patients who survived between 30 days and one year was 5.0% compared with 2.9% in the GUSTO-1 trial.6 All variables, except smoking and hypertension, were independent predictors of mortality within one year for 30-day survivors (table 2). The multivariate model had a good discriminatory performance (C-index 0.80, 95% CI 0.79 to 0.82, p<0.001). The C-index reported in the derivation cohort was 0.75.6
The GRACE risk model
For the 85 771 patients, in-hospital and six-month mortality rates were 8.6% and 12.9%, respectively, and were higher than those reported in the GRACE registry (4.6% for in-hospital7 and 4.8% at six months8). All GRACE model independent predictors were significant (table 2). The in-hospital (C-index 0.80, 95% CI 0.80 to 0.81, p<0.001) and 6-month (C-index 0.80, 95% CI 0.79 to 0.80, p<0.001) models were good discriminators of mortality, comparing well to the original C-indexes from the derivation cohorts (0.83 in hospital7 and 0.75 at six months8).
Simple Risk Index
For the cohort of 100 686 patients, the mean score was 27.9 (minimum 1.7, maximum 242.9). The numbers of patients in quintiles <15, 15 to 21, 21 to 28, 28 to 40, and >40 were 6886, 7171, 7063, 7546 and 6056, respectively. Although the mortality rate at 30 days for the SRI and MINAP cohorts was different (MINAP 12.3%, SRI 6.0%), the risk of death within 24 hours, in hospital and at 30 days increased with increasing SRI score (fig 1). The model discriminated well between survival and death within 30 days (C-index 0.79, 95% CI 0.78 to 0.80, p<0.001). The C-index reported for the derivation cohort was 0.78.10

The EMMACE risk model
We had data for 100 686 patients. The reported EMMACE 30-day mortality was 24.4%11 and compared with our 30-day mortality of 12.3% for STEMI. The model had a C-index of 0.78 (95% CI 0.77 to 0.78, p<0.001) compared with 0.77 for the original derivation cohort.11
All risk models were good discriminators of mortality within the MINAP dataset for the appropriate populations and over the specified time periods as reflected in C-indexes greater than 0.5. Despite large differences in mortality rates between the MINAP registry and the populations upon which the risk models were based, all the risk models were validated in the MINAP population with respect to their abilities to discriminate between survivors and non-survivors (table 3).
High-risk groups
When the various risk models were utilised to predict death among groups separated for the presence or absence of diabetes, or chronic renal failure, or a history of angina their ability to discriminate between death and survival was reduced when applied to higher risk subgroups (table 4).
EMMACE performance across the ACS spectrum
When the EMMACE model (and therefore the original linear predictors)11 was applied to patients with STEMI in the MINAP dataset, the C-index was 0.78 (95% CI 0.77 to 0.78). A recalibrated EMMACE model for 30-day mortality for STEMI patients was P(30) 1/(1 + exp(−L(30))), where L(30) (linear predictor of death at 30 days) −6.914 + 0.081 × age + 0.016 × HR – 0.016 × SBP and the C-index was 0.80 (0.79 to 0.80). The revised model for all ACS patients was P(30) 1/(1 + exp(−L(30))), where L(30) − 6.057 + ((0.072 × age) + (0.010 × heart rate) – (0.017 × SBP)) and the C-index was 0.78 (95% CI 0.77 to 0.78). The discriminative performances of the original and the revised EMMACE model according to discharge diagnosis and with regard to prediction of 30-day mortality are shown in table 5.
DISCUSSION
In this study, we validated five ACS risk scores (PURSUIT, GUSTO-1, GRACE, SRI and EMMACE) using a national registry of patients admitted to hospitals in England and Wales with ACS. These models, predominantly developed from randomised controlled trials and multinational registries, have good discriminatory power for the outcome of death over the time period for which they were designed. These findings are despite substantial differences in mortality rates between the studies’ original derivation cohorts and MINAP population. We have established that they have similar discriminative performances despite differences in the number of variables needed for the models. Moreover, we have demonstrated that the EMMACE risk model (a simple risk model that only utilises age, SBP and HR to predict 30-day mortality in patients with STEMI) maintained its discriminatory performance across the spectrum of ACS, and that recalibration did not offer any real improvement in its performance. In addition, we have shown that the performance of all the risk models is reduced in high-risk supergroups.
Although the models are designed for specific categories of ACS patients, we have demonstrated that the EMMACE risk model is applicable to the wider spectrum of ACS diagnoses. This has important clinical ramifications because it shows that the ACS risk scores are applicable to a “real world” population. As such, their use in risk stratifying patients and in allowing case-mix adjustment so that hospital performances may be compared is justified.11
Of the risk models studied, EMMACE and the SRI required fewer baseline data to obtain a comparable prediction of death—that is, although the GRACE, GUSTO-1 and PURSUIT models demonstrated equally good discriminatory performance this was at the expense of requiring extra data to generate a probability score. Specifically, the discriminatory ability of all the models being comparable corroborates Pine’s findings, that secondary abstraction of difficult-to-obtain key clinical findings adds little to the predictive power of risk-adjustment scores21 and contrasts with Yan et al’s findings that “simpler is not necessarily better”.28 Indeed, a useful risk model must balance ease of data collection with predictive ability.29 A common theme identified in all the risk models was the predictive power of age, SBP and HR on admission, even with respect to death occurring after discharge. These variables are readily accessible and are represented by the SRI and EMMACE risk scores.
Many ACS models are derived from randomised controlled trials (which may have excluded high-risk patients and may not be representative of the general population), or are validated only in the derivation cohort. This has the potential to overestimate their performance.30–33 In this study, we confirmed, as others have, that model performance was reduced in patients of higher cardiovascular risk (although the reduction in performance as shown by the C-index was small). This should be considered when applying risk stratification methods to higher-risk patients. The reduced performance of models in high-risk supergroups is primarily because of underestimation of comorbidities such as diabetes and chronic renal failure in the risk score (for example, GRACE includes the serum creatinine and has enhanced performance). Indeed, the addition of ejection fraction provides incremental information above that established risk scores.34
Mortality rates between the risk models’ derivation cohorts and the MINAP database were different. The GRACE, GUSTO-1 and PURSUIT scores demonstrated lower mortality rates in the derivation than in the MINAP cohort. This reveals the well-recognised difficulties in generating “real world” data from trial populations owing to exclusions of higher-risk individuals from clinical trials.35 Models with good performance have often been developed in temporally remote and specifically selected subpopulations—for example, patients with STEMI treated with fibrinolytic therapy excluding patients ineligible for such treatment.36 37 Consequently, these models may not be relevant to the majority of patients presenting with an ACS of which only a minority have STEMI. Furthermore, the greater use of newer therapies for ACS has altered model discriminative performances with time.38 In contrast, the mortality rate from the community-based EMMACE population was higher than that derived from the contemporary MINAP database and may represent advances in the provision of treatment and management of patients with STEMI.39
We found the EMMACE model to be a good discriminator of 30-day mortality for patients admitted with STEMI. Indeed revision of the model using patient characteristics from the MINAP dataset offered no improvement in performance. When applied to the entire ACS population, the model maintained its discriminatory ability. Of note is that it also performed well among the variety of ACS diagnoses, including those of lower risk. This supports the notion that the simple parameters of age, SPB and HR are important predictors of outcome for all ACS patients.
Clinical implications
Accurate determination of risk has become a major focus in the evaluation of patients presenting with ACS.40 Risk stratification is important to make appropriate decisions about the need for certain therapeutic interventions, level of care, and length of stay. Patients at highest risk for adverse outcomes may derive greater benefit from the use of effective treatments, and this benefit may be more likely to outweigh risks inherent to certain treatments such as thrombolytic therapy or percutaneous intervention.41 We have demonstrated that five popular ACS models are applicable to the English and Welsh population, that it is feasible to stratify risk based on patient age and haemodynamics on arrival (such as SBP and HR) and that other variables, such as electrocardiographic criteria, cardiac markers and renal failure, add only a small relative benefit to the overall performance of risk models. Simple models (such as EMMACE and SRI) allow more data completeness and may be more useful for case-mix adjustment, whereas more complex models (such as GRACE) may be more appropriately used for assisting physicians in making clinical decisions about individual patients.11 12 In confirming similar C-indexes between derivation and this “validation” population, we believe that audit data (such as that from the MINAP database) are likely to be sufficient for characterising the risk of populations, though models should be validated with observational studies.
This is the first time the utility of popular ACS risk models in a typical English and Welsh patient population has been demonstrated. We believe this is important and of significant clinical value. Validation of risk models within the population to which they are to be applied is essential. Only then can physicians, healthcare purchasers and providers be reassured of the performance of the models and subsequently their applicability for risk stratification and/or case-mix adjustment for inter-hospital comparisons.
Acknowledgments
We acknowledge all the hospitals in England and Wales for their contribution of data to MINAP.
REFERENCES
Footnotes
CG researched and wrote the manuscript. SM performed the statistics and wrote the article. CW, PB, JB and AH reviewed, wrote and critically appraised the article. All authors read and approved the final manuscript. The extract from the MINAP database was provided by JB.
Funding: MINAP is funded by the Healthcare Commission.
Competing interests: None.
Ethics approval: Ethics approval was not required.