Article Text

Abstract
Aim: To test whether quantitative stress echocardiography using contrast-based myocardial blood flow (MBF, ml.min−1.g−1) measurements can detect coronary artery disease in humans.
Methods: 48 patients eligible for pharmacological stress testing by myocardial contrast echocardiography (MCE) and willing to undergo subsequent coronary angiography were prospectively enrolled in the study. Baseline and adenosine-induced (140 μg.kg−1.min−1) hyperaemic MBF was analysed according to a three-coronary-artery-territory model. Vascular territories were categorised into three groups with increasing stenosis severity defined as percentage diameter reduction by quantitative coronary angiography.
Results: Myocardial blood flow reserve (MBFR)—that is, the ratio of hyperaemic to baseline MBF, was obtained in 128 (89%) territories. Mean (SD) baseline MBF was 1.073 (0.395) ml.min−1.g−1 and did not differ between territories supplied by coronary arteries with mild (<50% stenosis), moderate (50%–74% stenosis) or severe (⩾75% stenosis) disease. Mean (SD) hyperaemic MBF and MBFR were 2.509 (1.078) ml.min−1.g−1 and 2.54 (1.03), respectively, and decreased linearly (r2 = 0.21 and r2 = 0.39) with stenosis severity. ROC analysis revealed that a territorial MBFR <1.94 detected ⩾50% stenosis with 89% sensitivity and 92% specificity.
Conclusion: Quantitative stress testing based on MBF measurements derived from contrast echocardiography is a new method for the non-invasive and reliable assessment of coronary artery disease in humans.
Statistics from Altmetric.com
Stress echocardiography is a routinely used clinical tool for the evaluation of coronary artery disease. The qualitative assessment of stress tests entails considerable interobserver variability and an observer-independent—that is, quantitative approach is desired.1 Systolic and diastolic left ventricular function as well as myocardial perfusion may serve as surrogates of myocardial ischaemia and can be quantified by echocardiography. Since myocardial perfusion deficit is the primary consequence of coronary atherosclerosis,2 it has, accordingly, been studied by quantitative myocardial contrast echocardiography (MCE). However, the diverse techniques3 in use have produced protocol-dependent and equipment-dependent parameters that reflect myocardial perfusion more or less adequately. Consequently, MCE has recently been further developed to measure absolute myocardial blood flow (MBF, ml.min−1.g−1),4 which is the reference to quantify myocardial blood supply; moreover MBF measurements were reproducible—that is, good interobserver variability has been found. MCE was also able to detect residual MBF—that is, collateral blood flow, during coronary angioplasty.5 While positron emission tomography (PET) found functional recovery of myocardium with residual MBF >0.5 ml.min−1.g−1,6 we found a threshold of 0.374 ml.min−1.g−1 preventing ischaemia during 1-minute balloon occlusion.7 Therefore, MCE has the potential to evolve to an all-in-one assessment of coronary artery stenosis and myocardial viability. Also the relative blood volume (rBV, ml.ml−1) proved clinical significance while being an accurate discriminator between pathological and physiological left ventricular hypertrophy.8
While MCE-derived MBF measurements have been validated against PET, which represents the current gold standard in humans, its potential to detect significant coronary artery disease has not yet been established. We, therefore, conducted this prospective study aimed at (1) determining the diagnostic reliability of MBF measurements by MCE in the setting of coronary artery disease in patients referred for elective stress testing, and (2) comparing this approach with established quantitative MCE parameters.
METHODS
Study population
Patients (>18 years) admitted to our institution for the assessment of coronary artery disease (CAD) by stress testing were enrolled into the study if they agreed to undergo stress contrast echocardiography and subsequent coronary angiography. Exclusion criteria were acute coronary syndrome, history of myocardial infarction, coronary artery bypass graft surgery, congestive heart failure, higher-degree atrioventricular block, sick sinus syndrome, atrial fibrillation with uncontrolled ventricular rate, severe valve or pulmonary disease and known allergy to adenosine or the ultrasound contrast agent (UCA) SonoVue (Bracco SA, Mendrisio, Switzerland). The patients were not screened for echocardiographic image quality. The study protocol was approved by the ethics committee of the Kanton of Bern, Switzerland, and written informed consent was obtained from all patients.
Study protocol
Patients were told to maintain their routine medication but to cease caffeine and methylxanthine intake for at least 12 hours before stress testing. Transthoracic colour Doppler echocardiography was performed in all patients to exclude significant valvular disease or severe pulmonary artery hypertension. The stress protocol started with UCA—that is, SonoVue, infusion into the right cubital vein at a rate of 0.5–1 ml.min−1 (VueJect, Bracco SA, Manno, Switzerland). As a substitute of adenosine, physiological saline was infused at a rate of 2.8 ml.kg−1.h−1 via a parallel port to guarantee equal UCA concentrations at the entry site, thus allowing us to maintain baseline machine settings and UCA infusion rates during hyperaemia. After stable myocardial contrast enhancement was reached, baseline perfusion sequences were acquired from apical four-chamber and two-chamber views. UCA infusion was then discontinued and maximal coronary hyperaemia was induced by intravenous adenosine 140 μg.kg−1.min−1. UCA infusion was restarted after 4 minutes of adenosine and hyperaemic perfusion sequences were captured after a total of 6 minutes of adenosine administration. Invasive follow-up by coronary angiography was performed within 14 days; significant stenoses amenable to percutaneous intervention were treated according to standard clinical practice.
Quantitative myocardial contrast echocardiography
Real-time MCE was performed using a Sequoia C512 ultrasound scanner (Siemens Medical Solutions, Mountain View, CA, USA) equipped with a 4V1c transducer and Cadence contrast pulse sequencing. The machine settings were as follows: mechanical index for contrast detection 0.13, mechanical index for contrast destruction 1.3, dynamic range 50 dB, linear post-processing. Perfusion sequences—that is, UCA destruction-refill sequences, were generated using the manual bubble destruction feature of the scanner and recorded digitally for offline analysis. Clip length for baseline and hyperaemic perfusion sequences was 300 frames and 200 frames, respectively, with 75-ms trigger intervals. Image visualisation and quantification was done with DataPro 2.11 (Noesis SA, Courtaboeuf, France) using only end-systolic frames. The quantification algorithm, which is described in detail elsewhere,4 5 provided the relative blood volume (rBV, ml.ml−1) of the myocardium, the exchange frequency β (min−1) of this blood volume and myocardial blood flow (MBF, ml.min−1.g−1) to this region:

Coronary angiography
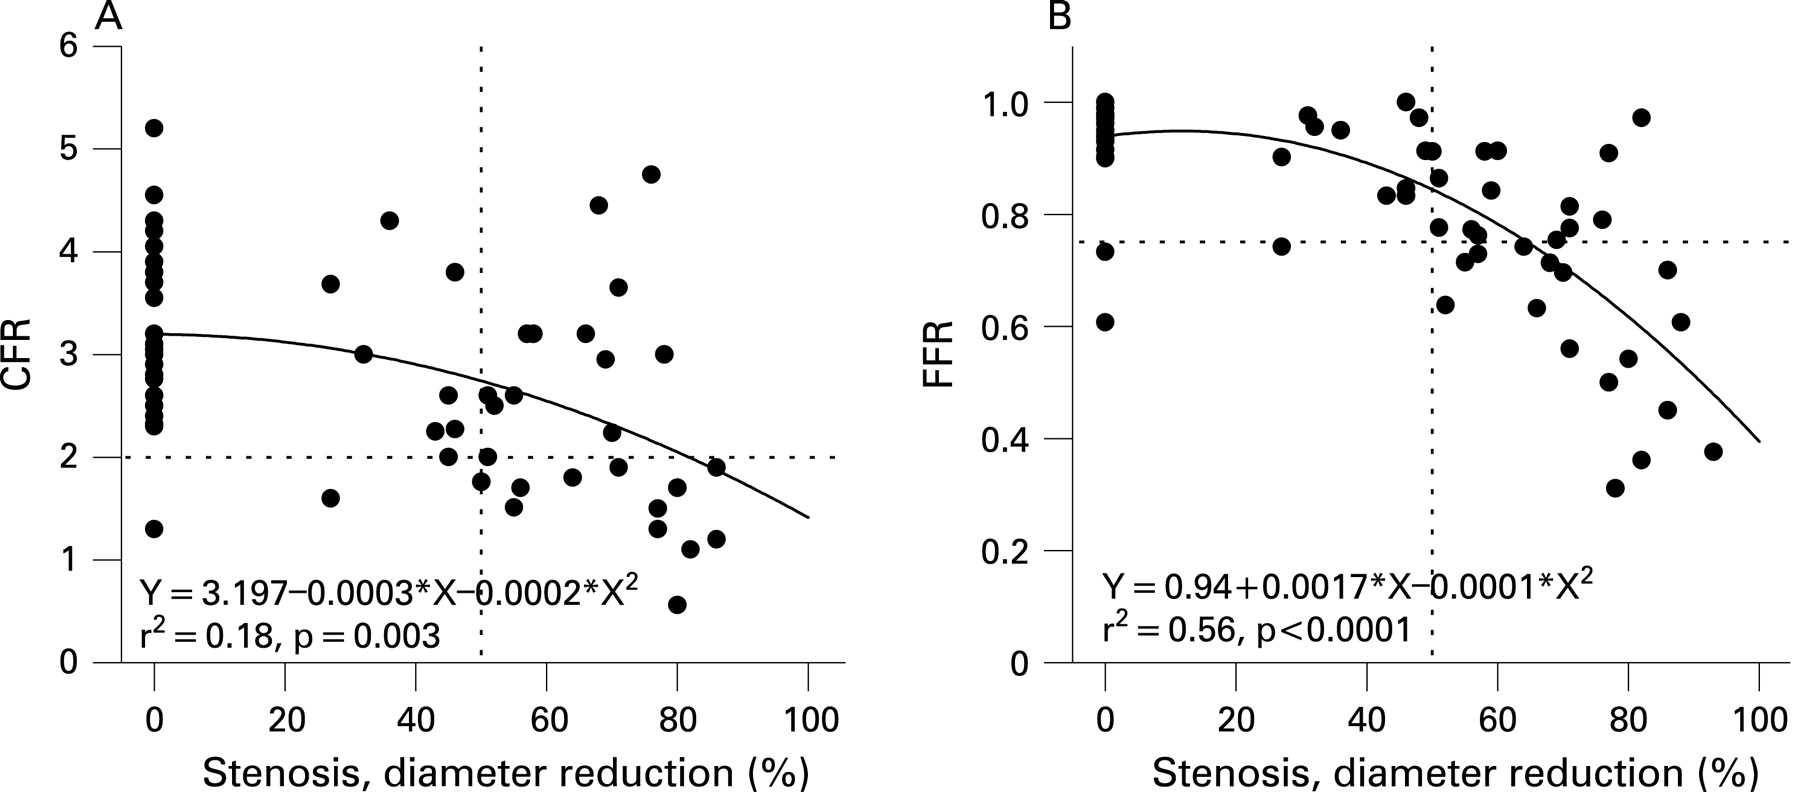
After two puffs of isosorbide dinitrate, biplane coronary angiography followed by left ventricular angiography was performed via the right femoral approach. Structural stenosis severity expressed as percentagediameter reduction was assessed offline using the catheterisation laboratory quantification software (Philips DA, Best, The Netherlands). Functional stenosis severity was assessed by coronary flow reserve (CFR) and fractional flow reserve (FFR). CFR distal to the target segment was calculated by dividing hyperaemic average peak flow velocity by baseline average peak flow velocity as obtained by intracoronary Doppler wire.9 FFR was determined as the ratio of mean intracoronary pressure distal to the lesion and mean aortic pressure simultaneously recorded during hyperaemia via the pressure wire and the angioplasty guiding catheter. Study-related CFR and FFR measurements were guided by the angiographic findings.
No significant stenosis: CFR and FFR of one coronary artery according to the investigators’ preference.
Single-vessel disease: CFR and FFR of the diseased vessel and a normal vessel according to the investigators’ preference.
Two-vessel disease: CFR and FFR of the two diseased vessels.
Three-vessel disease: CFR and FFR of one vessel according to the investigators’ preference.
CFR and FFR were measured using 0.014-inch Doppler guide wires (FloWire, Volcano Corp, Rancho Cordova, CA, USA) and 0.014-inch pressure monitoring guide wires (PressureWire, Radi Medical Systems, Uppsala, Sweden). Hyperaemia for CFR and FFR measurements was induced by an intracoronary bolus of 18 μg and 12 μg adenosine for the left and the right coronary artery, respectively.
Definitions and data analysis
Baseline and hyperaemic rBV, β and MBF of septal, lateral and inferior regions were derived from apical four-chamber and two-chamber views, respectively. The rate of hyperaemic to baseline β and MBF yielded the regional β-reserve and MBF reserve (MBFR). Coronary artery distributions as defined by the angiogram were matched with the myocardial territories from the MCE study. Territorial perfusion data were then compared with stenosis severity of related coronary arteries. Coronary arteries with poorly defined, non-significant sclerotic lesions were judged to be normal. Significant CAD was defined as the presence of at least one stenosis ⩾50% diameter reduction in a major coronary artery or major side branch (⩾2.25 mm diameter).
Statistical methods
Continuous data are expressed as mean (SD). Kruskal-Wallis tests have been used for comparison between groups and if significant followed by the Wilcoxon rank-sum test, the Wilcoxon signed rank tests for comparisons of repeated measures (before and during adenosine infusion). A univariate linear regression of the echocardiographic perfusion parameters (as independent variables) with the stenosis severity (as the dependent variable) has been done. The diagnostic performance of perfusion parameters for the detection of significant CAD (stenosis severity ⩾50%) was determined by receiver-operating characteristic (ROC) analysis; the area under the ROC curves (AUC) has been calculated for every perfusion parameter. The optimal operating point on the ROC curves have been determined by maximising the sum of sensitivity and specificity. Accuracy (defined as the sum of true positive and true negative test results divided by the total number of tests), AUC and the positive and negative predictive values for each parameter have been assessed. A p value below 0.05 was considered to indicate statistical significance.
RESULTS
The characteristics of the 48 enrolled patients are summarised in table 1; 27 patients (56%) had a history of stable angina pectoris. Left ventricular ejection fraction (biplane Simpson) was 60% (8%).
Quantitative stress testing
Stress testing was successfully performed in 46 patients and failed because of UCA infusion pump malfunction in one patient and due to adenosine intolerance in another (table 2). Among the 144 potential territories, baseline and hyperaemic MCE perfusion parameters were successfully analysed in 133 (92% success rate; failure in one septal, six lateral and four inferior territories) and 129 (90% success rate; failure in two septal, seven lateral and six inferior territories) territories, respectively. β-reserve and MBFR were finally obtained from 128 regions (89% success rate; failure in two septal, eight lateral and six inferior territories). Failure to obtain MCE perfusion parameters was related to the absence of contrast enhancement, unstable image plane or non-convergence of the fitting algorithm.
Overall and territorial baseline perfusion parameters—that is, rBV, β and MBF, significantly increased during hyperaemia (table 2). Multiple comparison procedures did not reveal significant differences between territorial baseline or hyperaemic perfusion parameters.
Coronary angiography
Eleven patients had no significant CAD—that is, clear coronary arteries or non-significant coronary sclerosis. CAD was present in 37 (77%) patients with the following distribution: single-vessel disease in 27 cases, two-vessel disease in six cases and three-vessel disease in four cases. Diameter reduction of disease-free (n = 93) and diseased (n = 51) vessels was 10% (16%) and 74% (14%), respectively.
Invasive haemodynamic assessment was feasible in 36 patients. CFR (n = 60: 35 left anterior descending arteries (LAD), 23 left circumflex arteries (LCx), two right coronary arteries (RCA)) and FFR (n = 68: 36 LAD, 24 LCx, 8 RCA) decreased with increasing stenosis severity following quadratic relations (fig 1). Mean (SD) CFR and FFR of coronary arteries free from significant disease was 3.1 (0.9) (n = 36) and 0.93 (0.08) (n = 39). In significantly diseased vessels, mean (SD) CFR and FFR was 2.4 (1.0) (n = 24) and 0.69 (0.17) (n = 29). Applying clinically accepted cut-off values (CFR = 2.0 and FFR = 0.75), CFR identified significant lesions with 46% sensitivity and 93% specificity and FFR with 55% sensitivity and 92% specificity.
Perfusion parameters versus quantitative coronary angiography
Baseline and hyperaemic rBV data did not correlate with stenosis severity (not shown) and, accordingly, rBV data grouped for stenosis severity (mild <50%, moderate 50–75% and severe >75%) did not differ significantly (table 3). Baseline β and MBF increased linearly with stenosis severity. Although statistically significant, these associations were very weak (fig 2A) without significant differences between stenosis severity subgroups (table 3). In contrast, hyperaemic β and MBF (fig 2A) as well as β-reserve and MBFR (fig 2B) clearly decreased with stenosis severity. Territories supplied by diseased coronary arteries had lower hyperaemic β, hyperaemic MBF, β-reserve and MBFR values compared to territories of disease-free vessels (table 3). Hyperaemic β and MBF in cases of moderate and severe stenosis were similar. Although baseline and hyperaemic β became undistinguishable in case of severe stenosis, which was not true for MBF, neither β-reserve nor MBFR data differed between moderate and severe stenosis.

Perfusion parameters versus CFR and FFR
β-reserve, MBFR and CFR data obtained in 53 territories and their related coronary arteries revealed that neither β-reserve nor MBFR correlated with CFR (data not shown). β-reserve, MBFR and FFR were obtained in 63 territories and their related arteries. β-reserve (r2 = 0.12, p = 0.03) and MBFR (r2 = 0.21, p = 0.0009) increased with FFR following quadratic relations, however, with poor correlation (not shown).
Diagnostic performance of quantitative MCE
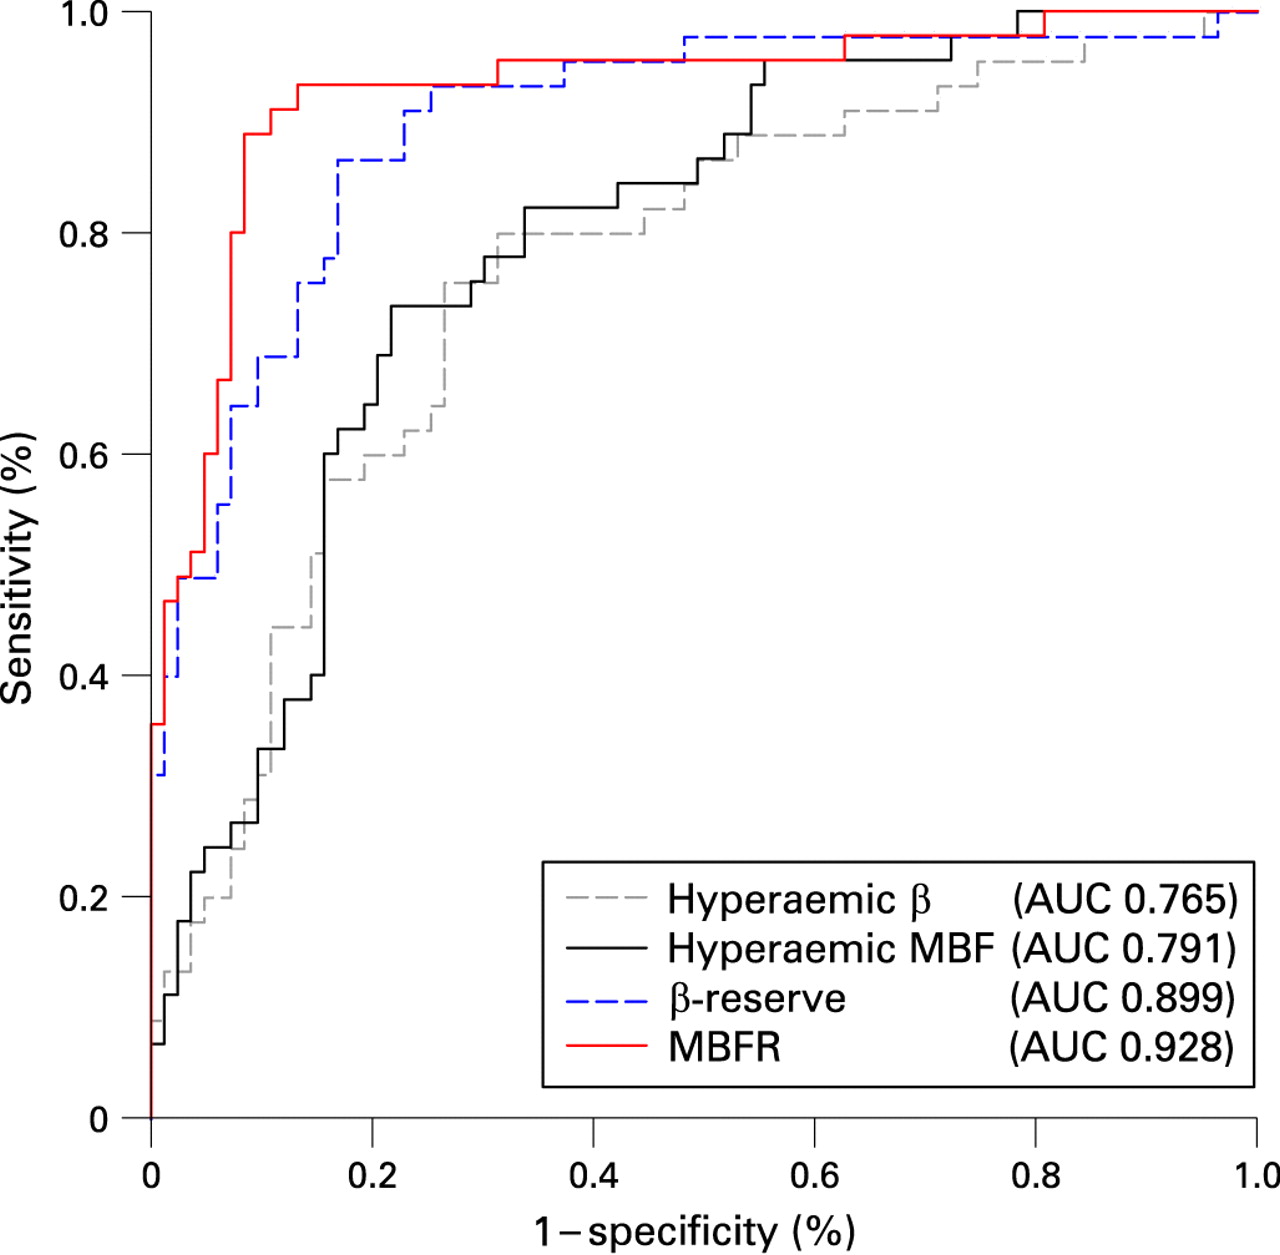
The weak association between baseline MCE perfusion parameters and stenosis severity (fig 2A) results in a poor diagnostic performance of baseline β (AUC 0.621, p = 0.022) and MBF (AUC 0.624, p = 0.019) to detect relevant CAD (ROC curves not shown). In contrast, the ROC curves in figure 3 demonstrate the increasing diagnostic performance of hyperaemic β, hyperaemic MBF, β-reserve and MBFR to detect clinical relevant CAD. The optimal cut-off values of these parameters are given together with their accuracies in table 4.

DISCUSSION
Myocardial blood flow given in absolute units of blood volume per time and myocardial mass (MBF, ml.min−1.g−1) is the reference to quantitatively assess myocardial blood supply. Its measurement by MCE has recently been introduced and comprehensively validated in perfusion phantoms, healthy volunteers, patients with CAD or hypertensive heart disease.4–9 In this prospective comparison with quantitative coronary angiography as gold standard, we demonstrated a high diagnostic performance of quantitative stress MCE for the detection of clinically relevant coronary artery disease. Furthermore and in agreement with the biophysical concept of perfusion, MBF and MBFR appear to be superior to traditional MCE perfusion parameters—that is, β and Aṡβ.
Diagnostic performance of quantitative MCE
Few studies compared the diagnostic performance of qualitative10 and quantitative11–15 MCE with the angiographic reference to detect stable CAD. Using various quantification techniques and protocols, the latter reported a sensitivity ranging from 71% to 97% and a specificity from 56% to 82%—that is, similar to qualitative analysis by experienced operators. Myocardial blood supply was quantitatively assessed by parameter β and/or the product A.β, where parameter A represented the steady state myocardial contrast enhancement serving as an estimate of the myocardial blood volume. The mentioned studies reported equal or even superior diagnostic performance of β-reserve compared to A.β-reserve, although according to the concept of perfusion, product A.β ought to be more appropriate to estimate myocardial perfusion. The study by Peltier et al11 reported the best results regarding diagnostic accuracy of A.β-reserve (85%, κ = 0.68) and β-reserve (87%, κ = 0.72). In our study, the diagnostic accuracy of β-reserve, was roughly the same (84%, κ = 0.67). However, the comparison with Peltier et al11 as well as the direct comparison within our study demonstrates that the performance of MBFR (accuracy 91%, AUC 0.928) is superior to that of β-reserve or Aṡβ-reserve, which may be explained by the fact that we, for the first time in the setting of stress echocardiography, have quantified myocardial blood supply by its gold standard MBF. The expense for this benefit is very small, since MBF studies only require some additional intensity measurements within the left ventricular cavity.
The present study demonstrates that quantitative MCE is feasible with a low number of failures. Excluding two patients, where stress testing failed because of UCA infusion pump malfunction and adenosine intolerance, complete MCE data were obtained in 93% of the territories. This success rate is in line with previous studies using the three-coronary-artery-territory distribution model4 7 11 and, of course, superior to studies using the 16-segment model.4 11 We did not consider basal regions since they are notoriously difficult to assess by MCE, whereas stress-induced perfusion defects mostly involve segments located near the apex. Furthermore, the three-territory model considerably reduces the time needed for image analysis, which renders quantitative MCE more suitable for clinical routine.
With regard to other non-invasive cardiac imaging stress tests MCE provides many fundamental advantages such as availability at bedside, lack of radiation exposure or magnetic field and low cost. PET, albeit the current gold standard for MBF measurements in humans, is troubled by technical problems such as partial volume effects and spillover and, importantly, the measurements depend on cell metabolism and membrane integrity.16 Whereas MRI can only provide qualitative estimates of MBF as a result of extravasation of tracers and the use of multiple correction factors, albeit detection of CAD by visual detection of hypoenhancement showed fairly high accuracy of 91% (sensitivity of 93% and specificity of 86%).17 18
Coronary physiology and MCE perfusion parameters
The concept of coronary autoregulation, mainly supported by animal data with artificial lesions,19 proposes curvilinear relations between stenosis severity and maximal perfusion as well as perfusion reserve that start to progressively decrease when diameter stenosis exceeds 50%. This straightforward model has already been challenged by Uren et al20 who demonstrated a regressive decrease in patients with single vessel disease. In our patients, similar to other reports,21 hyperaemic β and MBF as well as β-reserve and MBFR decreased linearly with stenosis severity (fig 2). This indicates that stenosis severity assessment by vessel percentage diameter reduction may be insufficient to characterise complex lesion geometry, long stenosis, diffuse stenosis or serial stenoses and multivessel disease.
Remarkably, our baseline β and MBF data weakly correlated with stenosis severity (fig 2A). These relations, however, are spurious owing to the confounding factor age, which is positively associated with the presence of more severe CAD and increased baseline MBF caused by the age-related increase of rate-pressure products (RPP).22 It has, therefore, been proposed to correct baseline MBF for the respective RPP by the ratio of the mean group RPP to the patient’s RPP.20 22 Although RPP-corrected baseline β and MBF no longer correlated with stenosis severity (data not shown), our analyses were based on raw data for the following reasons. First, the mean group RPP is a rather arbitrary parameter used in heterogeneous study populations to correct an individual patient’s basal myocardial oxygen consumption for age, heart rate and blood pressure. Second, it is unclear whether the uncorrected or the corrected perfusion reserve—that is, the actually achievable or the hypothetical maximal reserve, has to be considered as the clinically relevant parameter in the setting of CAD. Third, age-dependency of β and rBV has not yet been established and β data from previous studies have not been corrected for baseline RPP.
Critique of MCE perfusion parameters
Previous human studies11 23–25 have shown that β values vary widely with the MCE technique used—that is, the true biophysical value is confounded by the measurement chain. The quantification algorithm used here has provided equipment and protocol-independent β values as has been established earlier by in vitro and human studies.4 However, irrespective of measurement technique, β incompletely represents myocardial perfusion since myocardial blood volumes are not considered. The same applies to β-reserve with regard to coronary vasodilator reserve, since hyperaemia also affects myocardial blood volumes as has been demonstrated by previous4 7 and present (table 2) data. Independent of stenosis severity, adenosine infusion enlarged baseline myocardial blood volumes by approximately 20%, thus explaining that MBFR exceeds β-reserve by 16–20% (table 3). The physiological basis for this finding has been elucidated in a canine model by Spaan et al,26 showing that myocardial blood volumes dynamically change with perfusion pressure. By reducing the resistance of coronary arterioles, adenosine increases the capillary perfusion pressure, and therefore, distends the coronary capillary bed, which constitutes approximately 90% of the coronary microcirculation27—that is, the bulk of rBV. The dual action of adenosine on the coronary circulation—that is, increasing blood exchange frequencies (β) as well as blood volumes (rBV), is only entirely reflected by MBF (equation and MBFR; hence, this probably explains the superior diagnostic performance of MBF and MBFR as compared to β and β-reserve. Product A.β failed to clearly demonstrate a clinical benefit, although it considers myocardial blood volumes by parameter A. Parameter A, unlike rBV, is not a reliable estimate of the myocardial blood volume because of its dependency on UCA concentration that may vary from baseline to hyperaemic state. Furthermore, parameter A interferes with the fitting algorithm depending on signal noise and duration of the plateau relative to the refill.
The capillary bed’s dynamic pressure-volume relation26 insinuates that stenosis severity may affect adenosine-induced myocardial blood volume changes via arteriolar predilatation. In our patients, stenosis severity did not correlate with baseline rBV, or hyperaemic rBV or adenosine-induced rBV changes (data not shown), most probably because of the wide distribution of human rBV data.4 7
Limitations of the study
The presented quantitative stress test detected significantly narrowed coronary arteries supplying relevant territories—that is, requiring revascularisation by any strategy, with high sensitivity, specificity and accuracy. This approach, using a three-coronary-artery-territory distribution model, optimises the time needed for image quantification and MCE success rate and, other than 16-segment or 17-segment wall models, features a well-defined vessel-territory allocation. However, more detailed perfusion data are required to define the prognostic impact of echo-based MBF measurements by the comparison with morbidity and mortality data.
The adequacy of quantitative coronary angiography as the gold standard to assess clinical lesion significance is a matter of debate in many respects because this easily available morphological parameter does not take into account lesion length, or serial lesions or diffuse coronary narrowing. Moreover, morphological lesion assessment neglects balancing mechanisms at the level of the coronary circulation. For instance, the presence of coronary collaterals may explain some false negative results, whereas coronary steal phenomenon28 may further decrease β-reserve and MBFR. Complex lesion morphology and flow-relevant features of the coronary artery tree can be considered by assessing a lesion’s physiological significance using intracoronary haemodynamic measurements as have been implemented in this study. However, the results of these measurements were disappointing regarding the diagnostic performance of CFR and FFR (fig 1) as well as the direct comparison with MCE perfusion data. These findings are most probably related to the different doses and routes of adenosine administration for hyperaemia induction. During MCE, hyperaemia was induced by established intravenous continuous adenosine of 140 μg.kg−1.min−1,29 whereas during invasive measurements, we used intracoronary boluses of 18 μg and 12 μg for the left and the right coronary artery,30 respectively. However, other investigators proposed that much higher boluses (such as 150 μg31) of adenosine may be equivalent to standard continuous administration. Thus, the poor correlation of present invasive and non-invasive data is most likely the result of submaximal hyperaemia, which is especially true for the poor sensitivity of FFR. Intracoronary Doppler measurements are critically dependent on careful positioning of the wire in order to obtain true peak velocity profile, which is difficult in large vessels, tortuous segments and regions with varying luminal dimensions or configurations; moreover, turbulent baseline or hyperaemic flow distorts CFR.32 Additionally, missing data may have affected the diagnostic accuracy of the invasive measurements—that is, because of technical problems CFR was obtained only in 24 vessels and FFR in 29 vessels with significant stenosis (n = 51). However, we found good agreement between simultaneously assessed CFR using intracoronary Doppler measurements and MBFR from MCE using intracoronary boluses of adenosine in patients with CAD.4 We did not use continuous adenosine administration during the invasive procedure for ethical reasons.
Conclusion
By the comparison with the angiographic gold standard in humans, this study demonstrates that quantitative stress testing based on myocardial blood flow measurements obtained from contrast echocardiography is feasible and accurately identifies significant coronary artery disease.
REFERENCES
Footnotes
-
Funding: This work was supported by grants from the Swiss National Science Foundation (No 32-58945.99, to CS) and the Swiss Heart Foundation. The ultrasound equipment Acuson Sequoia was provided by Siemens Medical Solutions, Switzerland.
-
Competing interests: None.
-
Ethics approval: The study protocol was approved by the ethics committee of the Kanton of Bern, Switzerland, and written informed consent was obtained from all patients.