Article Text

Abstract
Context Right heart catheterisation is the gold standard for the diagnosis of pulmonary hypertension. However, echocardiography is frequently used to screen for this disease and monitor progression over time because it is non-invasive, widely available and relatively inexpensive.
Objective To perform a systematic review and quantitative meta-analysis to determine the correlation of pulmonary pressures obtained by echocardiography versus right heart catheterisation and to determine the diagnostic accuracy of echocardiography for pulmonary hypertension.
Data sources MEDLINE, EMBASE, PapersFirst, the Cochrane collaboration and the Cochrane Register of controlled trials were searched and were inclusive as of February 2010.
Study selection Studies were only included if a correlation coefficient or the absolute number of true-positive, false-negative, true-negative and false-positive observations was available, and the ‘reference standards’ were described clearly.
Data extraction Two reviewers independently extracted the data from each study. Quality was assessed with the quality assessment for diagnostic accuracy studies. A random effects model was used to obtain a summary correlation coefficient and the bivariate model for diagnostic metaanalysis was used to obtain summary sensitivity and specificity values.
Results 29 studies were included in the meta-analysis. The summary correlation coefficient between systolic pulmonary arterial pressure estimated from echocardiography versus measured by right heart catheterisation was 0.70 (95% CI 0.67 to 0.73; n=27). The summary sensitivity and specificity for echocardiography for diagnosing pulmonary hypertension was 83% (95% CI 73 to 90) and 72% (95% CI 53 to 85; n=12), respectively. The summary diagnostic OR was 13 (95% CI 5 to 31).
Conclusions Echocardiography is a useful and noninvasive modality for initial measurement of pulmonary pressures but due to limitations, right heart catheterisation should be used for diagnosing and monitoring pulmonary hypertension.
- Diagnosis
- echocardiography
- pulmonary hypertension
- right heart catheterisation
- screening
Statistics from Altmetric.com
The gold standard for the diagnosis and confirmation of pulmonary hypertension is right heart catheterisation. The main disadvantage of right heart catheterisation is that it is an invasive procedure and is associated with some morbidity (1.1%) and mortality (0.055%) even when performed at experienced centres.1 Although right heart catheterisation is the method of choice to define pulmonary hypertension, Doppler echocardiography is frequently used as an initial screening method to estimate pulmonary pressures. Compared with right heart catheterisation, Doppler echocardiography is non-invasive, inexpensive and widely available, and is therefore attractive not only as a screening tool for pulmonary hypertension but also as a method of monitoring disease progression over time.
Several echocardiographic methods have been utilised to determine pulmonary pressure. These include measurement of the tricuspid annular plane systolic excursion (TAPSE), two-dimensional strain, tissue Doppler echocardiography, the speckle tracking method, acceleration time across the pulmonic valve, the pulmonary artery regurgitant jet method and the tricuspid regurgitant jet method.2–5 The most commonly used and studied method is by measuring the velocity of the tricuspid regurgitant jet.6 Hatle et al7 first demonstrated that the gradient across a regurgitant tricuspid valve can be estimated from the peak velocity of the trans-tricuspid jet recorded by Doppler ultrasound. Yock and Popp8 first studied this method in 1984 in 50 patients and found good correlation between systolic pulmonary arterial pressure (sPAP) estimated with Doppler echocardiography compared with right heart catheterisation (r=0.93). By measuring the maximum velocity of the tricuspid regurgitant jet (v), the transtricuspid pressure gradient can be calculated using the modified Bernoulli equation (4v2).5 Right ventricular systolic pressure (RVSP) can then be estimated by adding the transtricuspid pressure gradient to the right atrial pressure (RAP).5 In the absence of pulmonic stenosis, the RVSP can be equated to the sPAP.5 Several methods have been utilised to measure RAP including clinical estimation from jugular venous pressure (JVP), using a fixed value (ie, 10 mm Hg) and using the diameter and collapse of the inferior vena cava (IVC) during spontaneous respiration. The last method is the most reliable and is the method recommended in echocardiography guidelines to measure RAP.9 Using this method, RAP has been estimated to be less than 10 mm Hg when the IVC diameter is less than 25 mm with greater than 50% inspiratory collapse, 10–20 mm Hg when the IVC diameter is greater than 25 mm with less than 50% inspiratory collapse and greater than 20 mm Hg when there are no changes in the IVC diameter.10
Several studies have been published in the literature addressing the correlation of pulmonary pressures obtained by echocardiography versus right heart catheterisation and addressing the diagnostic accuracy of echocardiography for pulmonary hypertension. The purpose of our study was to perform a systematic review and quantitative meta-analysis of the literature to determine the correlation of pulmonary pressures obtained by echocardiography (tricuspid regurgitant jet method) versus right heart catheterisation, and to determine the diagnostic accuracy of echocardiography (tricuspid regurgitant jet method) for pulmonary hypertension.
Methods
The systematic review and meta-analysis was performed according to the recently published recommendations and checklist of the PRISMA (Preferred Reporting Items for Systematic Reviews and Meta-analyses) statement.11
Searches were conducted on MEDLINE (inception February 2010); EMBASE (inception February 2010), PapersFirst (inception February 2010) and the Cochrane collaboration and the Cochrane Register of controlled trials for relevant studies. The following key terms were used: ‘echo’ or ‘echocardiography’ or ‘echocardiogram’ or ‘noninvasive’ AND ‘right heart catheterisation’ or ‘catheterisation’ or ‘invasive’ or ‘pulmonary hypertension’ or ‘pulmonary hemodynamics’. All searches were limited to ‘humans’ and ‘English’. We identified additional studies by searching the bibliographies of retrieved articles. Two independent reviewers (SJ and NS) performed the literature search.
All studies that appeared to fit the inclusion criteria were identified for full review by two reviewers (SJ and NS). Each reviewer independently selected studies for inclusion in the review. Disagreement between the two extracting authors was resolved by consensus. If consensus among the two reviewers could not be reached, a third author (JS) was deferred to for arbitration and consensus.
Studies relevant to the correlation of pulmonary pressure between echocardiography and right heart catheterisation were included if the following criteria were met: mean age greater than 18 years; RVSP was measured by Doppler transthoracic echocardiography and calculated from the maximum tricuspid regurgitation jet velocity by using the modified Bernoulli equation (4v2) and adding RAP; RAP was either clinically estimated using the JVP, a fixed value from 5 mm Hg to 10 mm Hg was used, or was estimated by measuring the IVC size and change with spontaneous respiration using echocardiography; sPAP was measured by right heart catheterisation; echocardiography was performed within 3 months of the right heart catheterisation; statistical correlation was performed between RVSP measured by echocardiography and sPAP measured by right heart catheterisation or a 2×2 contingency table could be formulated from the available data for the calculation of sensitivity and specificity; and Pearson, Spearman, Lin, or linear regression analysis-derived correlation coefficients were used. The Pearson correlation coefficient (r) is a measure of the strength of linear association between two approximately normally distributed continuous variables, while the Spearman's correlation coefficient (ρ) is a rank-based measure of linear association between two continuous variables in which at least one of them is not normally distributed.12 The Lin correlation coefficient (ρc), also called the concordance correlation coefficient, is a measure of the concordance between two continuous variables.13
The following variables were extracted from each study: publication year; country of origin of the study; study design; study population demographics; the echocardiography method used to calculate sPAP; mean values for sPAP by echocardiography and right heart catheterisation; correlation coefficient between sPAP by echocardiography and sPAP by right heart catheterisation; numbers of true-positive, false-negative, true-negative and false-positive observations; and threshold levels for echocardiography and right heart catheterisation for diagnosing pulmonary hypertension. The current guidelines define pulmonary hypertension as mean pulmonary arterial pressure (PAP) greater than 25 mm Hg or a tricuspid regurgitant velocity greater than 2.8 m/s.14 15 Moderate pulmonary hypertension is defined by the American College of Cardiology Foundation American Heart Association 2009 guideline statement14 as mean PAP of 35–45 mm Hg and severe as mean PAP greater than 45 mm Hg although Nef et al16 more recently suggested that moderate pulmonary hypertension be defined as mean PAP of 30–40 mm Hg and severe pulmonary hypertension as mean PAP greater than 40 mm Hg.
The methodological quality of the selected studies was graded independently by two reviewers (SJ and NS) with the quality assessment of diagnostic accuracy studies (QUADAS) tool, a validated tool for the QUADAS.17 We performed component analysis using the QUADAS tool, which was depicted as a proportional bar graph for each of the 14 individual criteria. Disagreement among the two reviewers was resolved by a third author (JS).
We retrieved all effect sizes in the form of Pearson, Spearman, Lin, or linear regression analysis-derived correlation coefficients. Following the recommendation by Hunter and Schmidt,18 we did not transform the correlation coefficient into Fisher's z scores as this transformation produces an upward bias in the mean estimation of the correlation coefficients because of the larger weights given to the larger correlations. On the other hand, this upward bias is usually higher than the negligible downward bias produced by untransformed correlations.
Heterogeneity between studies was explored using the I2 statistic, which is equal to Q−D/Q×100, where Q is the value for the Q statistic and D is the degrees of freedom. I2 values, which range from 0% to 100%, describe the proportion of variation in treatment effect estimates that is due to genuine variation rather than sampling error.19 A value of 0% indicates no observed heterogeneity. Sensitivity analysis was performed by recalculating the summary statistics after removing single studies or groups of studies from the analysis based on characteristics of the study design, study population, study year, severity of pulmonary pressures, echocardiography method and time between echocardiography and right heart catheterisation.
All meta-analyses were carried out using the DerSimonian and Laird20 random effects model. Subgroup analyses were carried out for various types of study populations (pulmonary hypertension, transplant (heart, lung or liver) and heart failure). Publication bias was assessed using Egger precision-weighted linear regression tests as well as the generation of a funnel plot.21 22
We used the bivariate model for diagnostic meta-analysis to obtain an overall sensitivity and an overall specificity.23 Instead of using the diagnostic OR, as used in conventional diagnostic meta-analysis,24 the bivariate model uses pairs of sensitivity and specificity as the starting point of the analysis. In addition to accounting for study size, the bivariate model estimates and incorporates the negative correlation that may arise between the sensitivity and specificity of the index test within studies as a result of differences in test threshold between studies. The bivariate model uses a random effects approach for both sensitivity and specificity, which allows for heterogeneity beyond chance as a result of clinical and methodological differences between studies. The summary estimates of sensitivity and specificity were used to calculate the average positive and negative likelihood ratios. Publication bias through small study effects was assessed with a regression test on the diagnostic OR.25
A hierarchical summary receiver operating characteristic (HSROC) graph, with the y-axis representing the index test's sensitivity (true-positive rate) and the x-axis representing 1-specificity (false-negative rate), was used to plot the individual and summary points of sensitivity and specificity. Furthermore, around the summary estimates, we also plotted a 95% confidence region and a 95% prediction region to illustrate the precision with which the summary values were estimated (confidence ellipse of a mean) and to show the amount of between-study variation (prediction ellipse; the likely range of values for a new study).
We used Stata intercooled version 10.1, in particular the metan command,26 the midas command27 and the metandi command28 for all statistical analyses.
Results
Our search yielded 2622 citations, of which 2544 were excluded for various reasons based on the title and abstract (figure 1). Eighty citations were then retrieved for full text review, of which 51 were excluded due to a mean age of less than 18 years (n=1), insufficient data (n=5) and the echocardiography method for the calculation of sPAP was not based on the maximum velocity of the tricuspid regurgitant jet (n=45). Twenty-nine studies were included in the systematic review. One study by Lanzarini et al29 used the same study population as in his study in 200230 for the calculation of sensitivity and specificity. Twenty-seven studies had correlation coefficients for the calculation of a summary value, whereas 12 studies29 31–41 had sufficient data for the calculation of a summary sensitivity and specificity value.
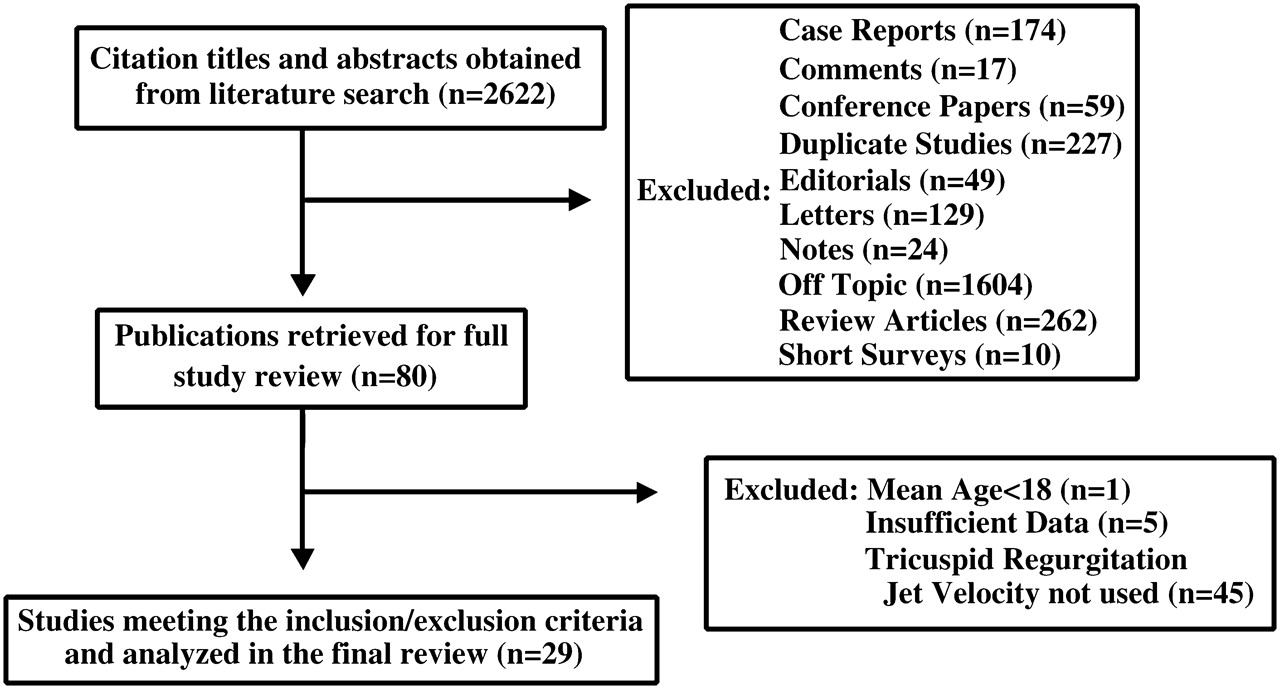
Flowchart for identification of studies.
Of the included studies, 69% (20/29) were published in 2000–9, 14% (4/29) were published in 1990–9 and 17% (5/29) were published in 1984–9. The majority of the studies (55%) were performed in the USA (16/29), whereas 34% (10/29) were performed in Europe, 7% (2/29) in Japan and 4% (1/29) in the Middle East. Furthermore, 76% (22/29) of the studies were prospective in design versus retrospective (24%, 7/29). The mean population age of the studies was 58 years (n=26) and the mean male percentage was 58% (n=25). A total of 1998 (n=28) patients was included in this review (Lanzarini et al29 duplicate study population; table 1).
Characteristics of the studies included in the meta-analysis
The patient populations evaluated by the studies included in this review were composed of a number of different underlying diseases (table 1). Study populations composed of patients with cardiac disease were evaluated in eight studies,30 38 41–46 lung disease in 16 studies31–34 36 37 39 40 47–54 and mixed cardiac and lung disease in four studies.8 35 55 56 Within the studies evaluating patients with lung disease, two study populations40 53 were composed of interstitial pulmonary fibrosis, three studies32 34 39 were composed of scleroderma patients, four studies33 36 37 54 were composed of chronic obstructive pulmonary disease (COPD) patients and seven studies31 47–52 included a mixed population of different types of lung disease (table 1).
All studies determined the maximum velocity of the tricuspid regurgitant jet using the modified Bernoulli equation (4v2) and then added this value to the RAP to calculate the RVSP. The RAP was determined using the diameter and collapse of the IVC during spontaneous respiration in 19 out of 29 studies, using the JVP in five out of 29 studies,8 32 44 46 54 using a fixed value (5 or 10 mm Hg) in four out of 29 studies34 36 47 50 and using a mix of JVP or a fixed value in one study.55 The tricuspid regurgitant jet was not measurable in 41% (513/1242, n=14 studies) of patients. The majority of these patients were from studies that included COPD patients alone (213/513, n=4 studies)33 36 37 54 or a mixed population of which COPD patients comprised the majority (235/513, n=2 studies)31 47 (table 1).
The time interval (mean or maximum) between right heart catheterisation and echocardiography ranged from simultaneous measurement to 3 months in the studies included in this review (table 1). The majority of the studies (85%, 22/26) had a time interval of less than 1 month (mean or maximum); only two studies39 47 had a time interval greater than 2 months; three studies37 38 56 did not report an interval time. Of the 22 studies that had a time interval of less than 1 month, 17 of those studies had a time interval of less than 1 week. The mean sPAP calculated by echocardiography was 59 mm Hg (n=17 studies) and by right heart catheterisation 60 mm Hg (n=18 studies).
Overall, the quality of the reported studies was modest (figure 2). Five studies44 48 49 52 53 may be subject to spectrum bias as their method of recruitment of patients consisted of recruiting a target group (patients with pulmonary hypertension) rather than applying the index and reference test to an unselected patient population (patients with and without pulmonary hypertension). A total of eight studies32 37–41 47 54 may be subject to disease progression bias because in three studies32 39 47 the time interval (mean or range) between right heart catheterisation and echocardiography was greater than 1 month and in five studies37 38 40 41 54 the time interval was not stated. Most studies may be subject to review bias as it was unclear in all 28 studies whether the investigators who used the reference test (right heart catheterisation) were blinded to the results of the echocardiogram, and in 24 studies8 29–43 45–47 50 51 54–56 it was unclear whether the investigators performing the index test (echocardiography) were blinded to the results of the right heart catheterisation.
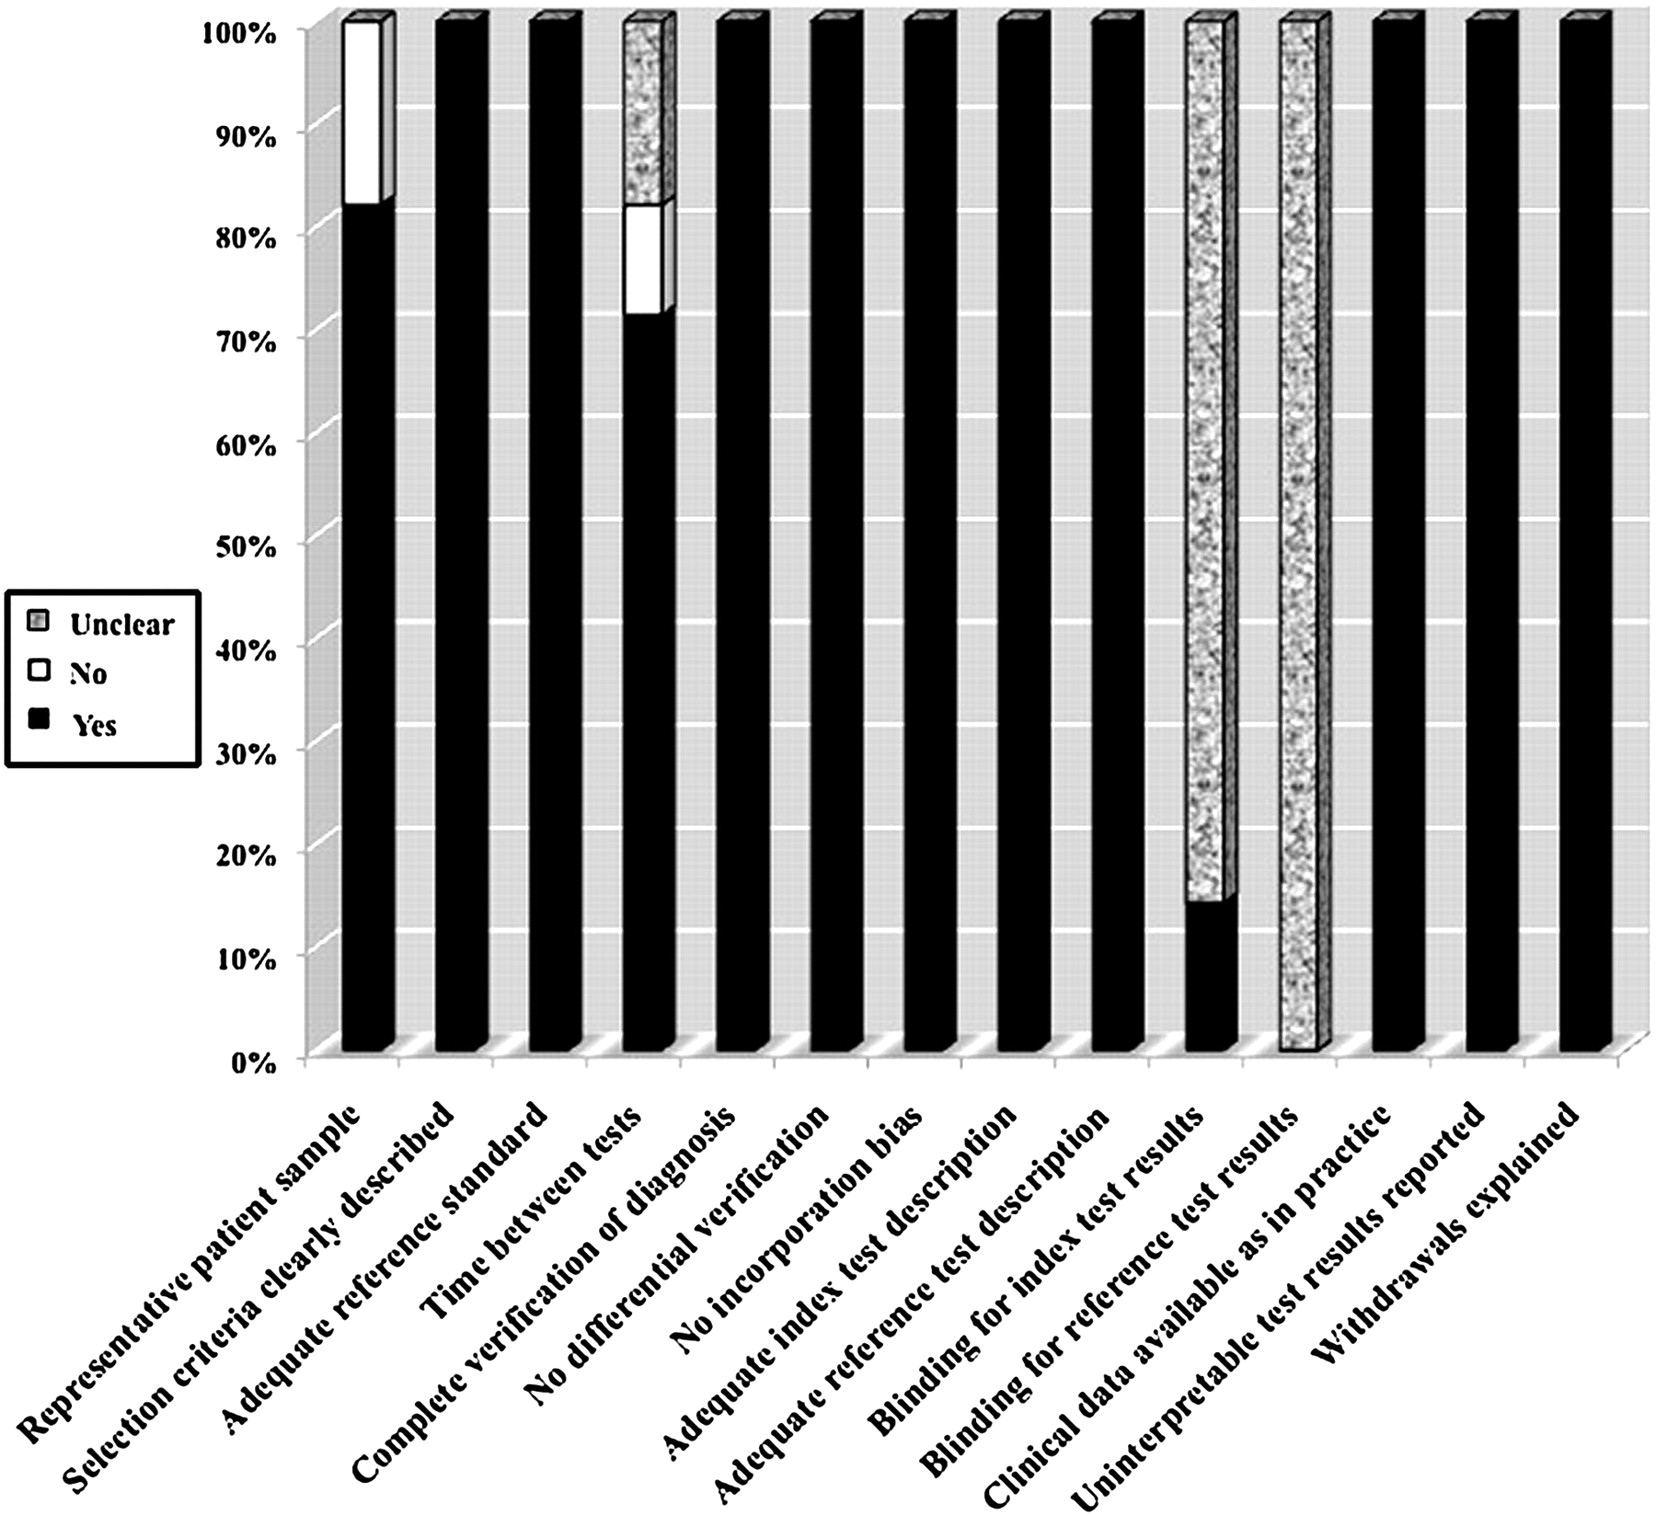
Proportion of all 14 quality assessment of diagnostic accuracy studies tool criteria that were fulfilled for the studies included in the meta-analysis (n=28).
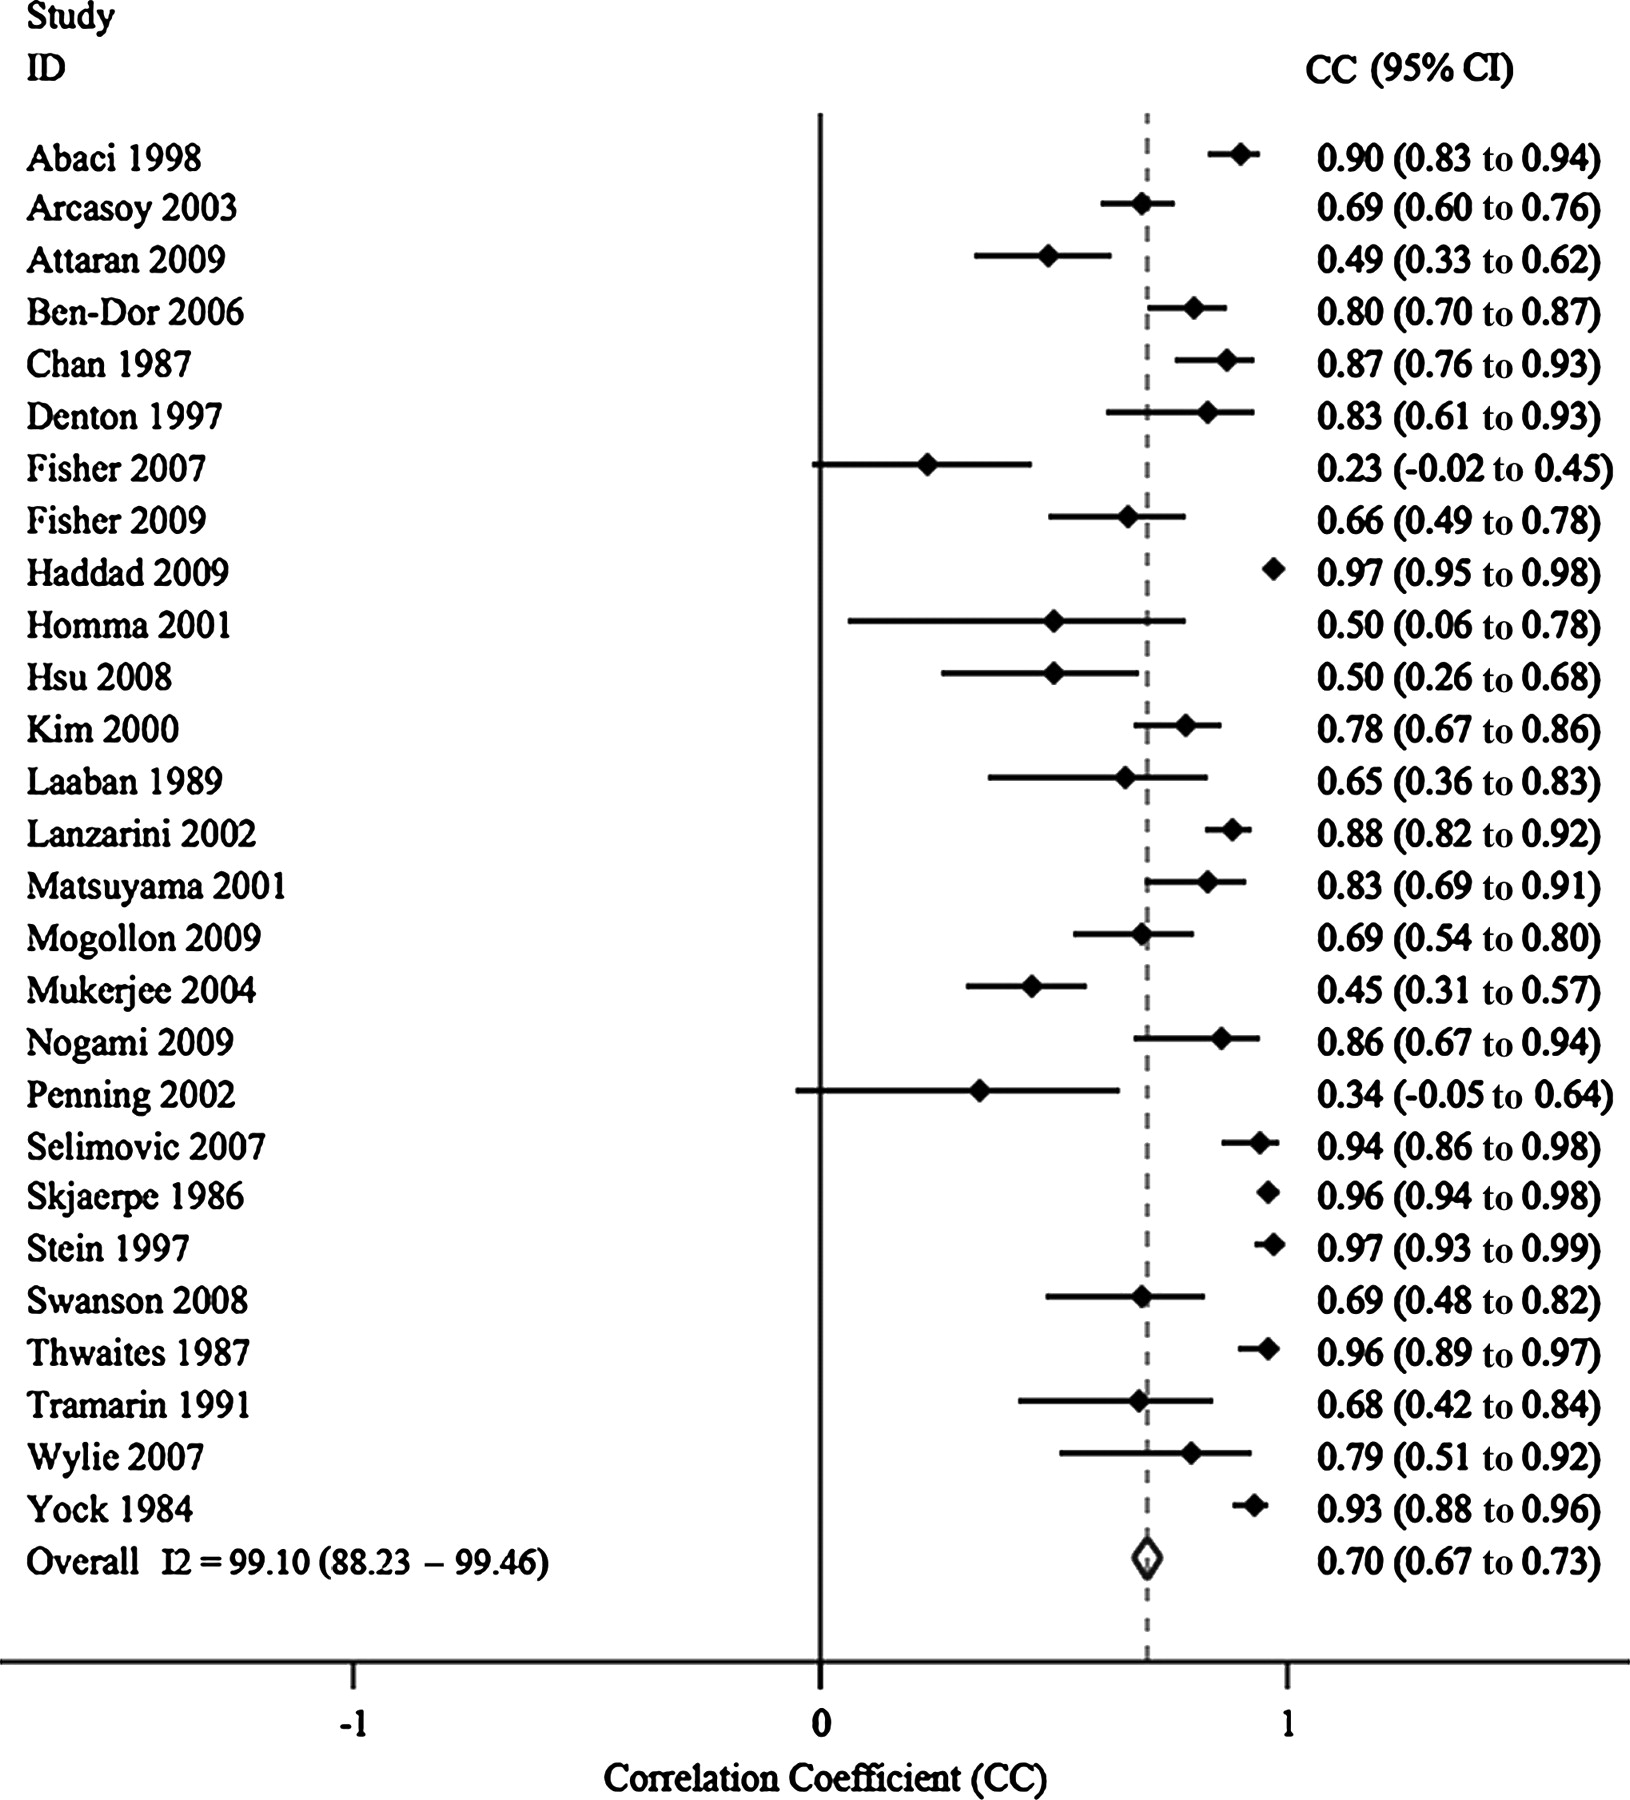
Correlation coefficients between echocardiography and right heart catheterisation-derived sPAP were available for 27 studies.8 30–39 41–56 The summary correlation coefficient using a random effects model was 0.70 (95% CI 0.67 to 0.73; figure 3). The I2 statistic was 99% (95% CI 88 to 99) indicating significant heterogeneity between the studies. Subgroup analysis for studies with a mean sPAP of 50 mm Hg or less revealed a summary correlation of 0.65 (95% CI 0.61 to 0.69; n=12)30 31 33 35 36 39 42 43 45–47 54 and for studies with a mean sPAP greater than 50 mm Hg, 0.71 (95% CI 0.65 to 0.77; n=8).38 41 48–50 52 53 56 Egger's test revealed significant publication bias (p<0.001), which was consistent with an asymmetrical funnel plot with missing studies in the lower left and upper right (figure 4).

Forrest plot of the summary correlation coefficient and I2 statistic for heterogeneity for the included studies (n=27).

Funnel plot for the summary correlation coefficient analysis (n=27).
Data sufficient to calculate sensitivity and specificity were available for 12 studies (table 2).29 31–41 The summary sensitivity and specificity of these studies was 83% (95% CI 73 to 90) and 72% (95% CI 53 to 85), respectively (figure 5). The summary positive likelihood ratio was 3.0 (95% CI 1.7 to 5.3) and the summary negative likelihood ratio was 0.24 (95% CI 0.14 to 0.39). The area under the receiver operating characteristic curve was 0.86 (95% CI 0.82 to 0.88) and the diagnostic OR was 13 (95% CI 5 to 31). Figure 6 shows the HSROC graph with 95% confidence region and 95% prediction region for echocardiography. The between-study variability (ie, heterogeneity) beyond what could be expected by sampling error was high, with an I2 of 82% (95% CI 73 to 91) for the sensitivity results and also high with an I2 of 85% (95% CI 78 to 92) for the specificity results. The bivariate model analysis reveals that this heterogeneity is minimally (9%) explained by threshold effect. Analysis of small study effects, potentially a result of publication bias, yielded no significant evidence for such effects with a p value of 0.64.
Diagnostic accuracy results of echocardiography versus right heart catheterisation for each study
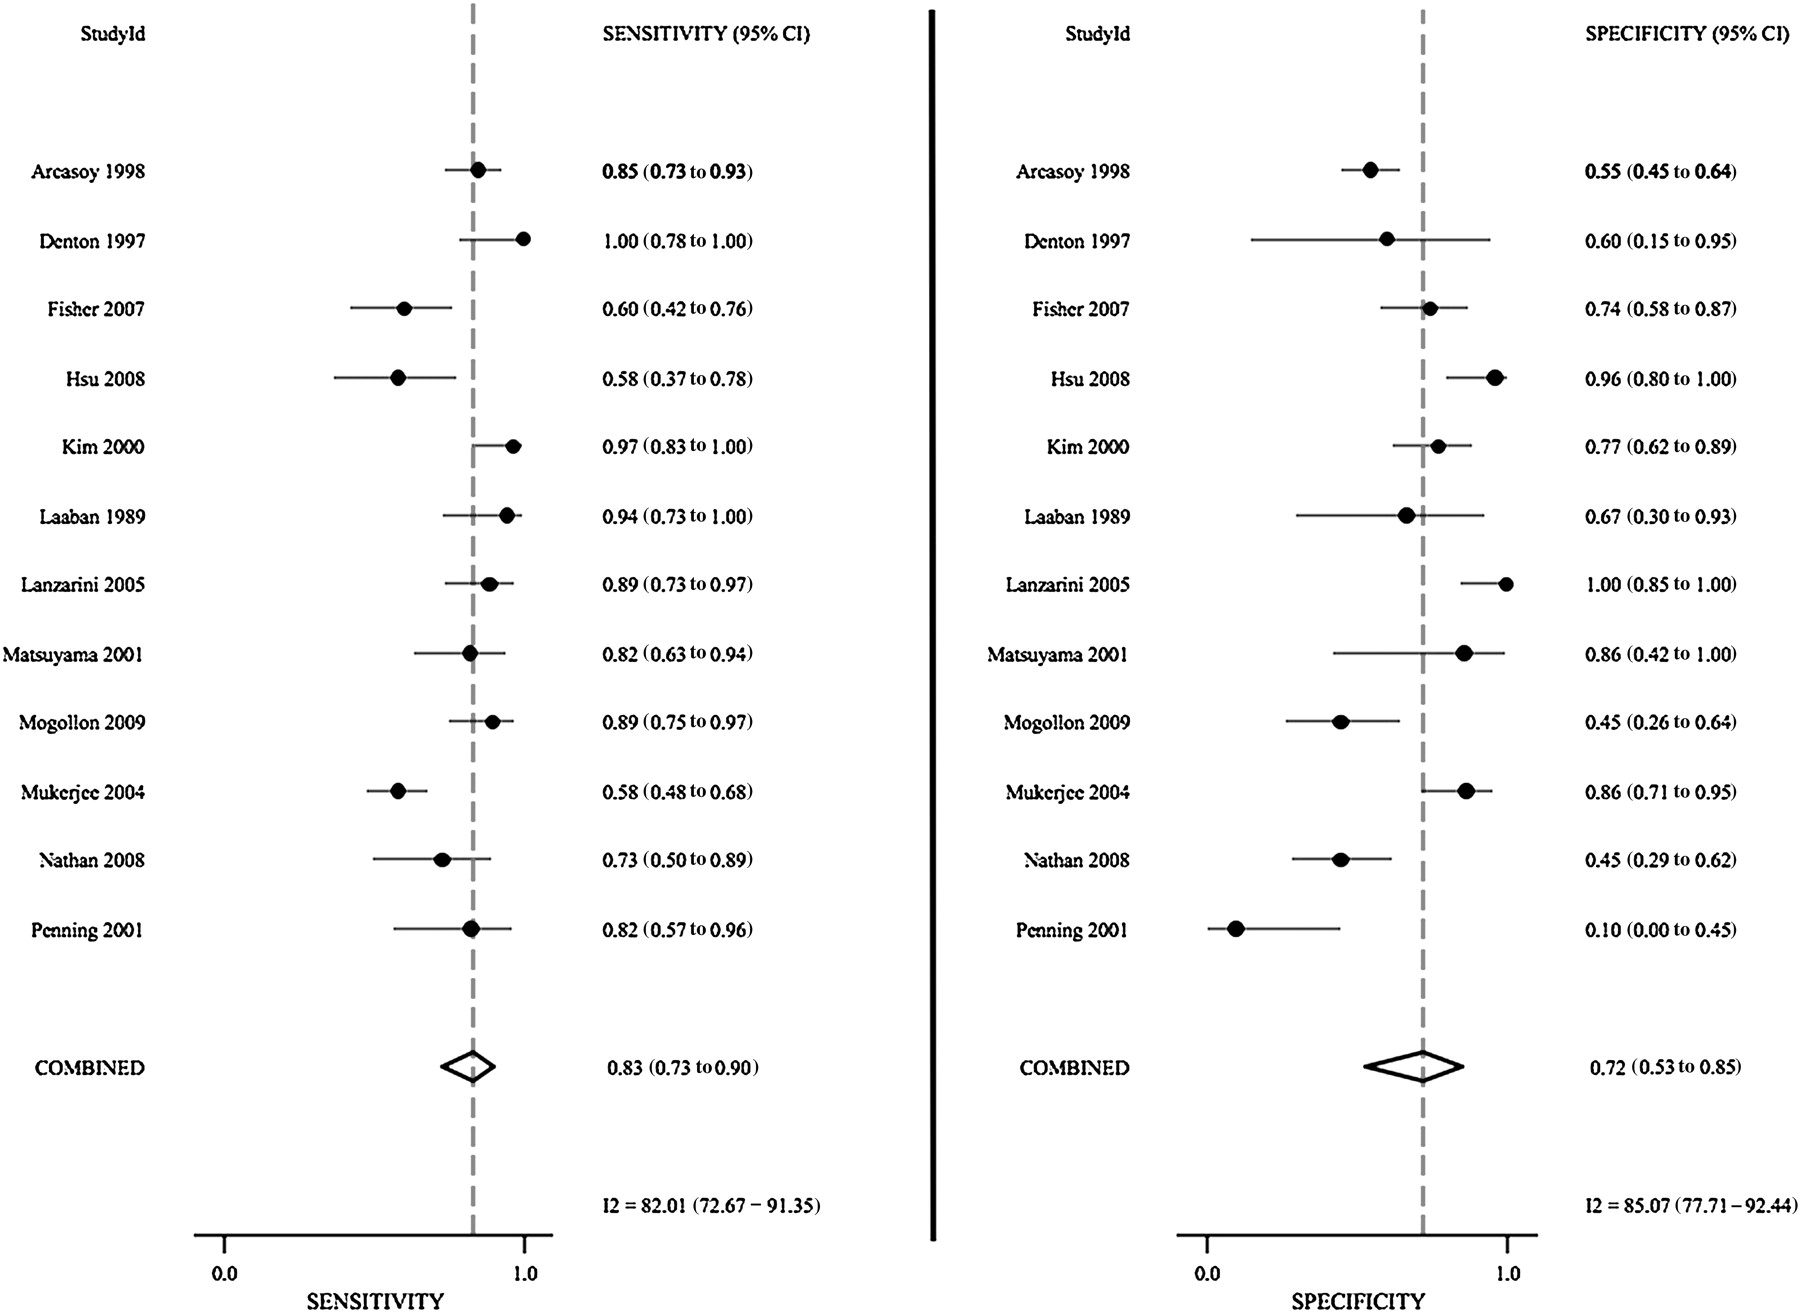
Forrest plot of the sensitivity and specificity of each individual study, summary sensitivity and specificity and I2 statistic for heterogeneity (n=12).

Hierarchical summary receiver operating characteristic (HSROC) graph with 95% confidence region and 95% prediction region for echocardiography (tricuspid regurgitant jet method) in the diagnosis of pulmonary hypertension (n=12).
Sensitivity analysis was performed for both the correlation coefficient analysis and the diagnostic accuracy analysis (table 3). Studies were grouped according to study design (prospective, retrospective), study year, study population (cardiac, lung, or mixed), echocardiographic method (IVC, fixed value, JVP), time interval from echocardiography to right heart catheterisation (<1 week, <1 month) and mean sPAP by right heart catheterisation. Sensitivity analysis did not reveal a source for the heterogeneity for either the correlation coefficient analysis or the diagnostic accuracy analysis.
Sensitivity analysis for the correlation and diagnostic accuracy meta-analyses
Discussion
The diagnosis of pulmonary hypertension can be quite challenging without the use of invasive strategies such as right heart catheterisation. A delay in diagnosis can lead to significant morbidity and mortality. Echocardiography is a non-invasive modality that can be used to screen and potentially diagnose individuals with pulmonary hypertension. Our study is the first systematic review and meta-analysis that summarises the diagnostic accuracy of echocardiography for pulmonary hypertension.
We included 29 studies, of which the majority were conducted in North America from 2000 to 2009, with a total patient population of 1998. We showed that the correlation of sPAP by echocardiography compared with sPAP by right heart catheterisation was modest, with a summary correlation coefficient of 0.70 (95% CI 0.67 to 0.73). Furthermore, we showed that the diagnostic accuracy of echocardiography for pulmonary hypertension was also modest, with a summary sensitivity and specificity of 83% (95% CI 73 to 90) and 72% (95% CI 53 to 85), respectively.
Overall, the quality of the studies was generally modest, with the majority being prospective in design. The main limitations of the studies were the possibility of spectrum bias, disease progression bias, review bias and population bias. Spectrum bias refers to distortions in a diagnostic test's performance caused by a distortion in the study population. Testing is not performed across a population with the expected distribution of disease severity, but rather limited subsets.57 In our meta-analysis, five studies44 48 49 52 53 acquired their study population by selecting pulmonary hypertension patients rather than selecting undiagnosed patients. The presence of spectrum bias can lead to an overestimation of the sensitivity and specificity of the test.57 Disease progression bias is a bias that occurs if the results of the diagnostic test under study and of the reference standard test are not collected on the same patients at the same time.17 Eight studies32 37–41 47 54 were subject to disease progression bias in our review. This may have led to either an over or underestimation of the diagnostic accuracy of echocardiography for pulmonary hypertension. Review bias refers to a situation in which persons interpreting the index test have knowledge of the reference standard, or vice versa when persons interpreting the reference standard have knowledge of the index test.58 In our meta-analysis, it was very unclear whether this did or did not occur because the majority of the studies did not report whether blinding during testing was done. This may have led to an overestimation of the diagnostic performance of the test. Finally, population bias refers to the generalisability of the diagnostic test to a wider population.59 The studies included in our meta-analysis had poor reporting of any co-morbid conditions within the PH group thus potentially limiting generalisability.
Several echocardiographic techniques of assessing right ventricular function as a surrogate of pulmonary pressure are available including measurement of the TAPSE, two-dimensional strain, tissue Doppler echocardiography, the speckle tracking method, acceleration time across the pulmonic valve, the pulmonary artery regurgitant jet method and the tricuspid regurgitant jet method.2–5 The method of echocardiography to measure sPAP in our study was dependent on the tricuspid regurgitant jet as this is the most commonly used technique in clinical practice. The corresponding systolic continuous wave spectral Doppler can be obtained using an apical four-chamber view and/or a parasternal short axis view at the level of the tricuspid valve. Careful adjustment of the transducer position and the use of colour flow Doppler are critical in order to reduce the Doppler angle and to obtain the maximal regurgitant flow velocity.10 The sPAP is then calculated from the modified Bernoulli equation (4v2) and added to the RAP. The modest correlation of sPAP from echocardiography versus sPAP from right heart catheterisation and the modest diagnostic accuracy of echocardiography for pulmonary hypertension in our review can be explained by several potential limitations of Doppler echocardiography for estimating pulmonary pressure. First, the alignment of the ultrasound beam to the tricuspid regurgitant jet should ideally be parallel in order to obtain the maximum velocity.10 Second, there should be no distal obstruction (ie, right ventricular outlet obstruction, pulmonic valve stenosis and supravalvular stenosis).5 Finally, the continuous wave Doppler spectrum may be suboptimal or absent, but one way of overcoming this is through the use of contrast agents that enhance the velocity signal.60 It has been shown that contrast improves the detection of the tricuspid regurgitant jet by Doppler, thus minimising the underestimation of sPAP.61–63 From our meta-analysis, we found that approximately 41% of patients (513/1242) did not have an optimal tricuspid regurgitant jet to allow the measurement of sPAP. The majority of these patients had COPD and thus this method may not be reliable in this patient population unless contrast is used.
Studies with different study populations (cardiac disease, lung disease (idiopathic pulmonary fibrosis, scleroderma, COPD, mixed), mixed cardiac and lung disease) were included in this analysis. When the tricuspid regurgitant jet was adequately visualised, there was no difference in the correlation of sPAP by echocardiography versus right heart catheterisation and no difference in the diagnostic accuracy of echocardiography for pulmonary hypertension (tables 1 and 2).
In our review we found that the correlation of sPAP from echocardiography versus right heart catheterisation was generally the same in studies with mildly elevated mean sPAP (≤50 mm Hg by right heart catheterisation) compared with studies with moderately elevated mean sPAP (>50 mm Hg by right heart catheterisation) with summary correlation coefficients of 0.65 (95% CI 0.61 to 0.69) and 0.71 (95% CI 0.65 to 0.77), respectively. As the highest mean sPAP for a study in our review was 85 mm Hg, we cannot comment on the correlation of sPAP by echocardiography versus right heart catheterisation in patients with severely elevated sPAP. In patients with very high pulmonary arterial pressures, echocardiography can underestimate sPAP by 20 mm Hg or greater as shown by Brecker et al64 in 10 patients with severe pulmonary hypertension (average sPAP 109 mm Hg) being considered for lung transplant. The underestimation of sPAP is a concern when the tricuspid regurgitant jet is of fair or poor quality. Fisher et al48 showed that in 12 patients whose echocardiographic estimated sPAP was greater than 20 mm Hg below the right heart catheterisation measured value, 10 of the patients had inadequate tricuspid regurgitant jets. This is expected because the accuracy of the Doppler method is contingent upon obtaining the correct peak velocity from which the sPAP can be estimated. Underestimation of sPAP by echocardiography is more likely to misclassify the severity class of pulmonary hypertension (mild, moderate, severe) in patients compared with overestimation, as shown by Fisher et al.48 Furthermore, Fisher et al48 also showed that a lesser degree of tricuspid regurgitation is more common in patients with underestimated pressure by Doppler echocardiography. In addition, very severe tricuspid regurgitation can lead to an inability to maintain the usual right ventricle–right auricle pressure gradient and can lead to an underestimation of sPAP.
The sensitivity and specificity of a test depends on the threshold cut-off. In our review the echocardiographically estimated sPAP cutoffs ranged from 32 to 50 mm Hg for diagnosing pulmonary hypertension. The most common threshold cut-off was 40 mm Hg. A subgroup analysis of the studies (n=6)33 37–41 with 40 mm Hg as the cut-off produced a summary sensitivity of 76% (95% CI 64 to 85) and a summary specificity of 58% (95% CI 36 to 77), which is not statistically significant from the complete analysis. Therefore, a threshold value of 40 mm Hg for sPAP for echocardiography produces only modest diagnostic accuracy for pulmonary hypertension and can lead to false-positive and false-negative measurements.
Significant heterogeneity was evident in both analyses (correlation and diagnostic accuracy). Sensitivity analysis (table 3) did not reveal a source for the heterogeneity. Heterogeneity for the diagnostic accuracy analysis was not related to threshold effects as the HSROC graph (figure 6) had only two studies fall within the 95% confidence region, one study intersecting the 95% confidence region and eight studies beyond the 95% confidence region. The most likely source for the heterogeneity for both analyses was due to a combination of variation in study populations (cardiac, lung, mixed), study design, spectrum bias, disease progression bias, review bias and population bias. Furthermore, there may have been intra-observer differences among the echocardiography technicians as well as the echocardiographers reading the echocardiograms, which could not be tested for. In addition, the measurement of sPAP is variable among repeat measurements even by the same method due to many confounders beyond the control of the diagnostic test, such as volume status, systemic blood pressure and changes in oxygenation among COPD patients, as examples. Furthermore, even measurements of sPAP on the same day may be significantly variable due to these patient-related factors. Finally, publication bias was evident in the correlation analysis, as shown by an asymmetrical funnel plot (figure 4) that was missing negative studies. Although the significant heterogeneity does limit the generalisability of the results, the information gained is still useful for providing a contextual basis for echocardiography versus right heart catheterisation for the diagnosis of pulmonary hypertension.
Measurements of pulmonary pressure by Doppler echocardiography should be taken into context with other echocardiographic parameters to improve diagnostic yield in patients with pulmonary hypertension. These parameters include structural assessment of the right ventricle, evaluation of the tricuspid and pulmonic valves, assessment of the size of the pulmonary artery and assessment for pericardial effusion.5 A number of echocardiographic parameters have been associated with mortality in pulmonary arterial hypertension including the presence or severity of pericardial effusion,65–67 right atrial area indexed to body surface area,67 end-diastolic eccentricity index,67 right ventricular Tei index,68 the TAPSE,2 pulmonic flow acceleration time,65 IVC size/collapse69 70 and the severity of tricuspid regurgitation.69
In conclusion, our systematic review and meta-analysis on the correlation of sPAP estimated by echocardiography (tricuspid regurgitant jet method) versus measured by right heart catheterisation and the diagnostic accuracy of echocardiography for pulmonary hypertension is the first on this topic. From our review we conclude that there is modest correlation between sPAP estimated from echocardiography compared with measured by right heart catheterisation for mild to moderate values of sPAP. The diagnostic accuracy for echocardiography for pulmonary hypertension with a sPAP threshold of 40 mm Hg is also relatively modest. Potential limitations include the possibility of weak correlation and diagnostic accuracy in patients with high pulmonary pressures, inability to acquire an estimate of sPAP in certain patient populations (ie, COPD), and underestimation when the tricuspid regurgitant jet is not of good quality. When measuring pulmonary pressures by echocardiography, clinical context, the prevalence of pulmonary hypertension in the patient population and other echocardiographic parameters of the right ventricle should be taken into consideration to improve the overall diagnostic accuracy of echocardiography for pulmonary hypertension. Considering the limitations, echocardiography is a useful and non-invasive modality for measuring pulmonary pressure and for determining underlying anatomical and functional cardiac abnormalities in patients with suspected pulmonary hypertension. However, the diagnosis of pulmonary hypertension and the assessment of response to therapies requires right heart catheterisation.
References
Footnotes
Funding JS is supported by the VGH and UBC Hospital Foundation's In It for Life Fund as well as an Academic Enhancement Award from the University of British Columbia Department of Medicine.
Competing interests None.
Provenance and peer review Not commissioned; externally peer reviewed.
Linked Articles
- PostScript