Article Text

Abstract
Background Measurement of the degree of aortic valve calcification (AVC) using electron beam computed tomography (EBCT) is an accurate and complementary method to transthoracic echocardiography (TTE) for assessment of the severity of aortic stenosis (AS). Whether threshold values of AVC obtained with EBCT could be extrapolated to multislice computed tomography (MSCT) was unclear and AVC diagnostic value in patients with low ejection fraction (EF) has never been specifically evaluated.
Methods Patients with mild to severe AS underwent prospectively within 1 week MSCT and TTE. Severe AS was defined as an aortic valve area (AVA) of less than 1 cm2. In 179 patients with EF greater than 40% (validation set), the relationship between AVC and AVA was evaluated. The best threshold of AVC for the diagnosis of severe AS was then evaluated in a second subset (testing set) of 49 patients with low EF (≤40%). In this subgroup, AS severity was defined based on mean gradient, natural history or dobutamine stress echocardiography.
Results Correlation between AVC and AVA was good (r=−0.63, p<0.0001). A threshold of 1651 arbitrary units (AU) provided 82% sensitivity, 80% specificity, 88% negative-predictive value and 70% positive-predictive value. In the testing set (patients with low EF), this threshold correctly differentiated patients with severe AS from non-severe AS in all but three cases. These three patients had an AVC score close to the threshold (1206, 1436 and 1797 AU).
Conclusions In this large series of patients with a wide range of AS, AVC was shown to be well correlated to AVA and may be a useful adjunct for the evaluation of AS severity especially in difficult cases such as patients with low EF.
- Aortic valve disease
- CT scanning
Statistics from Altmetric.com
Aortic valve stenosis (AS) is the most common valvular heart disease in western Europe and its prevalence is going to increase dramatically with the ageing of the population.1 Management of patients with AS relies on accurate assessment of symptoms, AS severity and left ventricular ejection fraction (EF).2–4 Evaluation of AS severity is currently mainly based on transthoracic echocardiographic measurements of maximal aortic peak velocity, mean transaortic pressure gradient (MPG) and aortic valve area (AVA) calculated using the continuity equation.5 According to current recommendations, severe AS is defined as an AVA less than 1 cm2 (or 0.6 cm2/m2 of body surface area), an MPG greater than 40 or 50 mm Hg and a peak aortic velocity greater than 4.0 m/s.6 However, echocardiographic evaluation of AS severity may be technically challenging in patients with poor echocardiographic windows such as obese patients or patients with severe chronic obstructive pulmonary disease. Furthermore, in patients with depressed EF and low-flow/low-gradient (LF/LG) AS, transthoracic echocardiography (TTE) at rest is not conclusive requiring additional testing such as dobutamine stress echocardiography (DSE) to differentiate severe from pseudo-severe AS.7–10
Aortic valve calcification (AVC) is the leading process to aortic valve stenosis. Measurement of the degree of AVC using electron beam computed tomography (EBCT) has previously been validated as a complementary method for the evaluation of AS severity.11 However, whether thresholds defined with EBCT could be extrapolated to multislice computed tomography (MSCT) measurements was unknown. In addition, despite being theoretically interesting, the diagnostic value of AVC measurements in differentiating severe AS from non severe AS in patients with depressed EF has never been evaluated.
Therefore, the aims of the present study were, using MSCT, to evaluate the relationship between the degree of AVC and AS haemodynamic severity, to define thresholds of AVC for the diagnosis of severe AS and to test these thresholds in a subset of patients with depressed EF.
Methods
Study design
Patients with AS, enrolled between November 2006 and April 2010 in two ongoing prospective studies, COFRASA (clinicalTrial.gov number NCT00338676) and GENERAC (clinicalTrial.gov number NCT00647088) aimed at evaluating the determinants of occurrence and progression of AS, underwent comprehensive TTE and MSCT within 1 week. Inclusion criteria were patients with at least mild AS (defined by an MPG ≥10 mm Hg). Exclusion criteria were a pacemaker because of CT potential artifacts and renal failure (creatinine clearance <30 ml/min) as, in patients with severe renal insufficiency, AS progression is mainly influenced by calcium–phosphorus product changes. Patients in atrial fibrillation or with a history of coronary artery disease were not excluded. MSCT measurements were performed blinded to any clinical or echocardiographic data and patients were managed independently of AVC measurements. Our population was divided into two subsets. In patients with preserved EF (EF >40%, validation set), we evaluated the relationship between AS haemodynamic severity and AVC and defined thresholds of AVC for the diagnosis of severe AS. Then, the diagnostic value of AVC thresholds was evaluated in a second subset of patients with depressed EF (EF ≤40%, testing set).
Echocardiography
All patients underwent a comprehensive echocardiography performed by experienced echocardiographers using high quality commercially available ultrasound systems. Evaluation of AS severity was performed based on peak velocity, mean gradient and calculation of the AVA using the continuity equation as recommended by current guidelines. Severe AS was defined by an AVA of less than 1 cm2. In patients with LF/LG AS (EF ≤40%, AVA <1 cm2 and MPG ≤40 mm Hg), AS severity was further evaluated using natural history or DSE. In patients with known high gradient before the index evaluation (natural history), DSE was not performed and patients were classified as having severe AS. In the others, a DSE was performed. Details of the DSE have been described previously.7 Briefly, dobutamine infusion was begun at 5 mg/kg body weight per min, titrated upwards in steps of 2.5 mg/kg per min every 5 min up to a maximal dose of 20 mg/kg per min. The dobutamine infusion was stopped when the maximal dose or heart rate acceleration of 10 beats/min or greater was reached. Blood pressure and ECG were monitored throughout the test. Aortic Doppler velocities and time–velocity integrals were measured at the end of each step. The left ventricular outflow tract was considered constant. In patients with contractile reserve (increase in aortic stroke volume ≥20%), AS was graded as severe (increase in AVA <0.3 cm2 with a final AVA ≤1 cm2) or pseudo-severe (increase in AVA >0.3 cm2 with a final AVA >1 cm2).8 12 In the absence of contractile reserve, DSE was considered non-conclusive. The left ventricular EF was visually estimated and confirmed using the Simpson's biplane method of discs in patients with depressed EF.13 Other measurements were performed as recommended by echocardiographic societies.13 14
MSCT measurements
MSCT was performed using a 16-detector Philips scanner (MX 8000 IDT 16, Phillips Medical Systems, Andover, MA, USA). A scan run consisted of a prospective acquisition of 43-mm thick contiguous transverse slices. Acquisition time was 0.5 s/slice, electrocardiography triggered at 75% of the RR interval. No contrast enhancement was needed nor was a β-blocker administered for the purpose of the examination. Measurements were obtained offline using dedicated semi-automatic software (heart beat calcium scoring; Philips Medical Systems, Andover, MA, USA). Calcification was defined as four adjacent pixels with density greater than 130 Hounsfield units. The degree of AVC was defined as the calcium score according to Agatston et al15 and expressed in arbitrary units (AU). Aortic valve calcium was defined as calcification within the valve leaflets, aortic annulus, or aortic wall immediately adjacent to leaflet or annular calcification. Two MSCT runs were performed sequentially with 1 or 2 mm initial interval. Each run was independently scored and the two scores were averaged. Radiation exposure was typically between 2 and 3 mSV.
Statistical analysis
Continuous variables were expressed as mean±standard deviation (SD). Comparison between groups used analysis of variance t test or χ2 test as appropriate. Correlation between AVC (MSCT score) and AS haemodynamic severity was tested with linear and non-linear regressions, and the equation providing the best fit was retained.
The diagnostic value of the degree of AVC for the diagnosis of severe AS (AVA <1 cm2) was analysed. Sensitivity, specificity, positive and negative-predictive values were determined for various thresholds and area under the curve (AUC) of the receiver operator characteristic (ROC) analysis was calculated. In 20 patients, AVC was measured twice several days or weeks apart by the same observer for intraobserver variability and by a second blinded observer for interobserver variability. A p<0.05 was considered statistically significant.
Results
Population
Two hundred and thirty-two patients with AS were enrolled in the present study. Four were finally excluded because of MSCT motion artifacts. The mean age was 78±7 years, 62% were men and 88% were in sinus rhythm. The aortic valve was tricuspid in 206 patients (83%), bicuspid in 22 (10%) and non-evaluable in 16 (7%). Mean EF was 54±14%. One hundred and seventy-nine patients were included in the validation set (EF >40%) and 49 patients in the testing set (EF ≤40%). Baseline characteristics of the population are summarised in table 1.
Baseline characteristics of the population
Relationship between AVC and haemodynamic severity in the validation set
The 179 patients enrolled in this subset had a wide range of AS severity (valve area 1.20±0.47 cm2, median 1.15 cm2, range 0.35–2.3 cm2). Based on AVA, AS was graded as mild or moderate in 98 patients (55%) and severe in 81 (45%). The mean AVC score was 1934±1712 AU (median 1515, range 42–8376 AU).
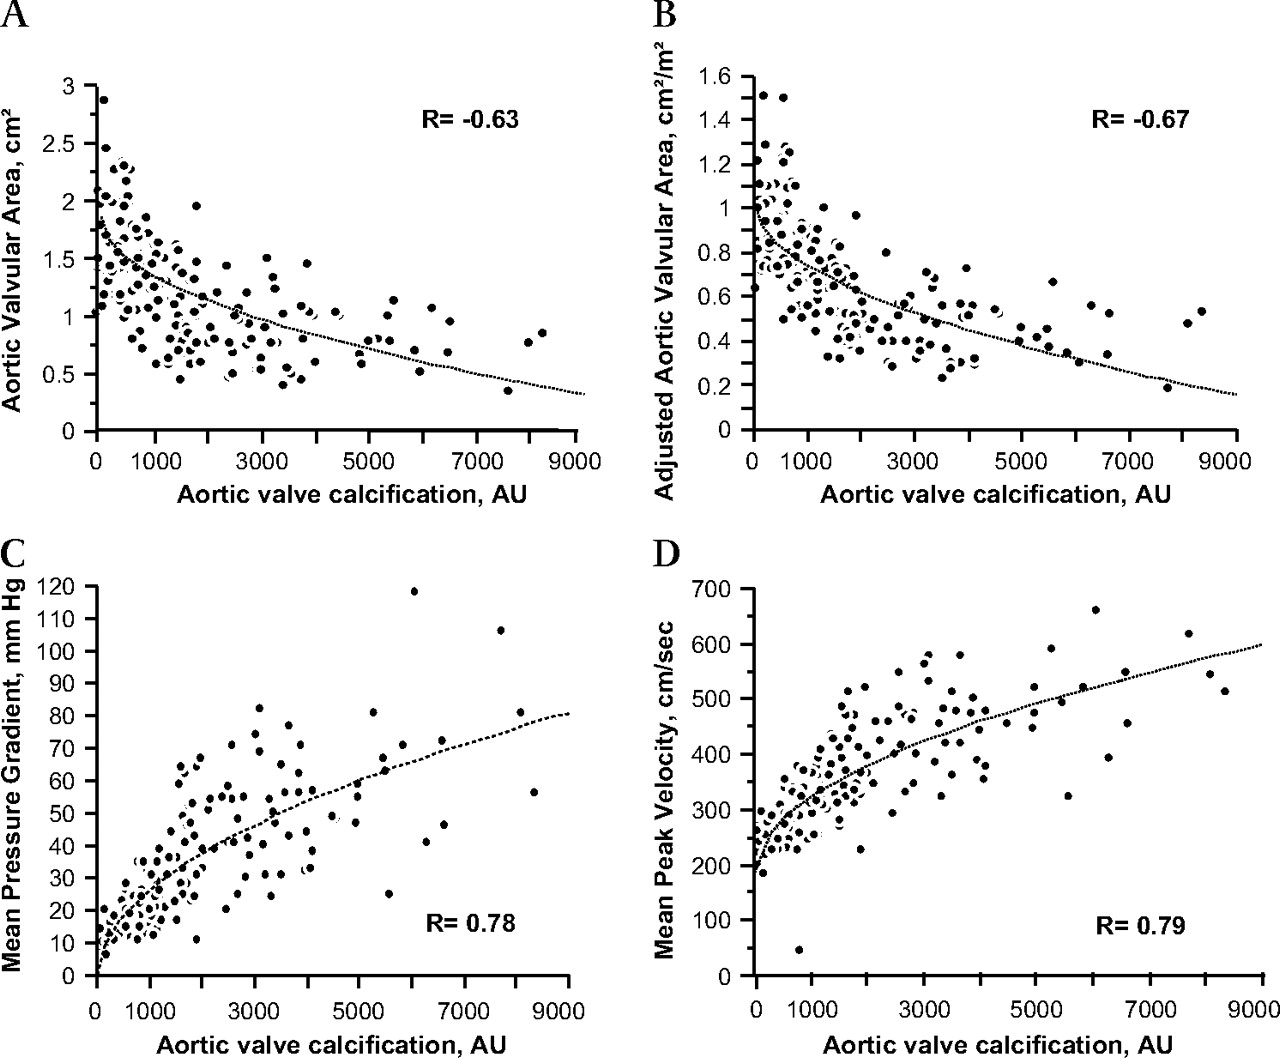
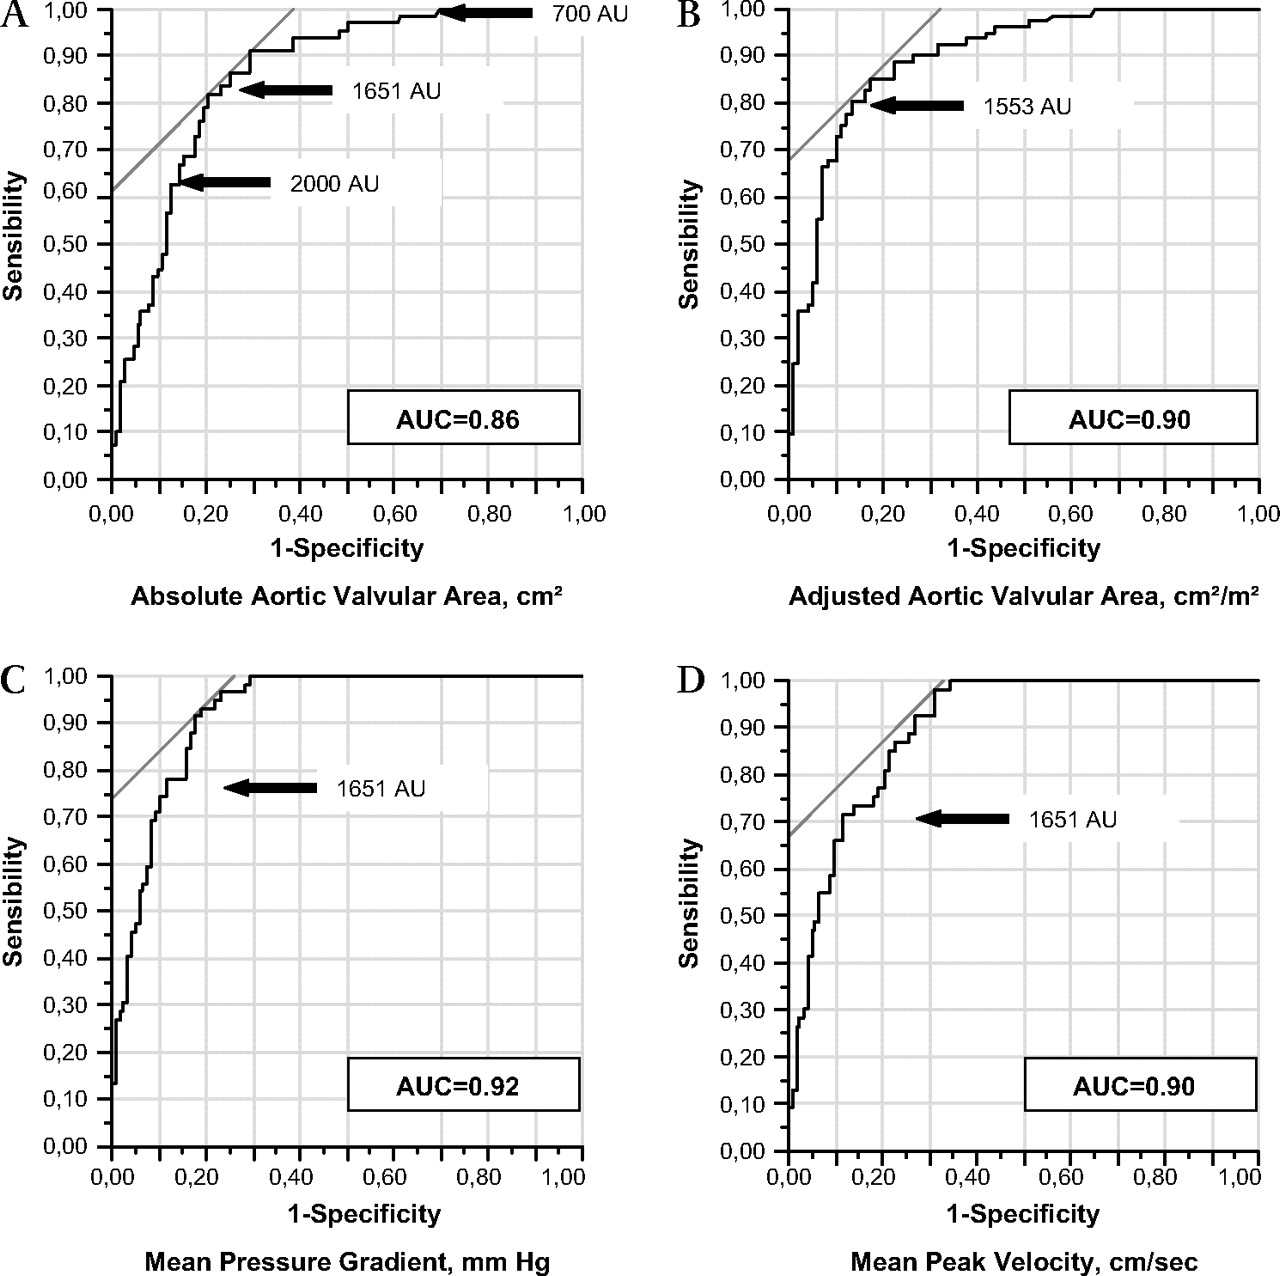
There was a good correlation between the degree of AVC and haemodynamic parameters of AS severity assessed by either the absolute valve area (r=−0.63, p<0.001), indexed valve area (r=−0.67, p<0.001), mean gradient (r=0.78, p<0.001) or peak velocity (r=0.79, p<0.001) (figure 1). The relationship was curvilinear (AVA=3.16–0.27×ln(AVC)). The AUC of the ROC analysis for the diagnosis of severe AS either based on absolute valve area (AVA <1 cm2, AUC=0.86), indexed valve area (AVA <0.6 cm2/m2, AUC=0.90), mean gradient (MPG >40 mm Hg, AUC=0.92) or peak velocity (>4 cm/s, AUC=0.90) were excellent, demonstrating a high diagnostic value of AVC measurements (figure 2). Sensitivity, specificity, negative-predictive value and positive-predictive value of various AVC scores for the diagnosis of severe AS based on absolute AVA are indicated in table 2. A threshold of 1651 AU was associated with the best sum of sensitivity (82%) and specificity (80%). A threshold of 700 AU provided a high sensitivity (98%) and negative-predictive value (98%), whereas a threshold of 2000 AU provided a good specificity (86%) and average positive-predictive value (72%). Similar results were obtained when indexed AVA, MPG or peak velocity were considered instead of absolute AVA. Exclusion of patients in atrial fibrillation or with bicuspid valves did not significantly affect our conclusions. Of note, among the four patients initially excluded because of motion artifacts, none was in atrial fibrillation.

Validation set. Correlation between the degree of aortic valve calcification (arbitrary unit; AU) measured using multislice CT (x axis) and echocardiographic measurements of haemodynamic severity. (A) Absolute aortic valve area (cm2), (B) indexed aortic valve area (cm2/m2), (C) mean pressure gradient (mm Hg) and (D) maximal peak velocity (cm/s).

Validation set. Receiver operator characteristic curves for the diagnosis of severe aortic stenosis according to (A) absolute aortic valve area (<1 cm2), (B) indexed aortic valve area (<0.6 cm2/m2), (C) mean pressure gradient (>40 mm Hg), (D) maximal peak velocity (>4 cm/s) using the aortic valve calcification score measured by multislice CT. Note the large area under the curve (AUC) consistent with high diagnostic value. The large arrow indicates the threshold providing the best sum of sensitivity plus specificity.
Diagnostic value for severe AS of various thresholds of AVC score
Intraobserver variability was 4±10% (68±130 AU) and interobserver variability was 6±7% (74±77 AU). The mean time for AVC measurement was approximately 5 min.
Accuracy of AVC for the assessment of AS severity in patients with depressed EF
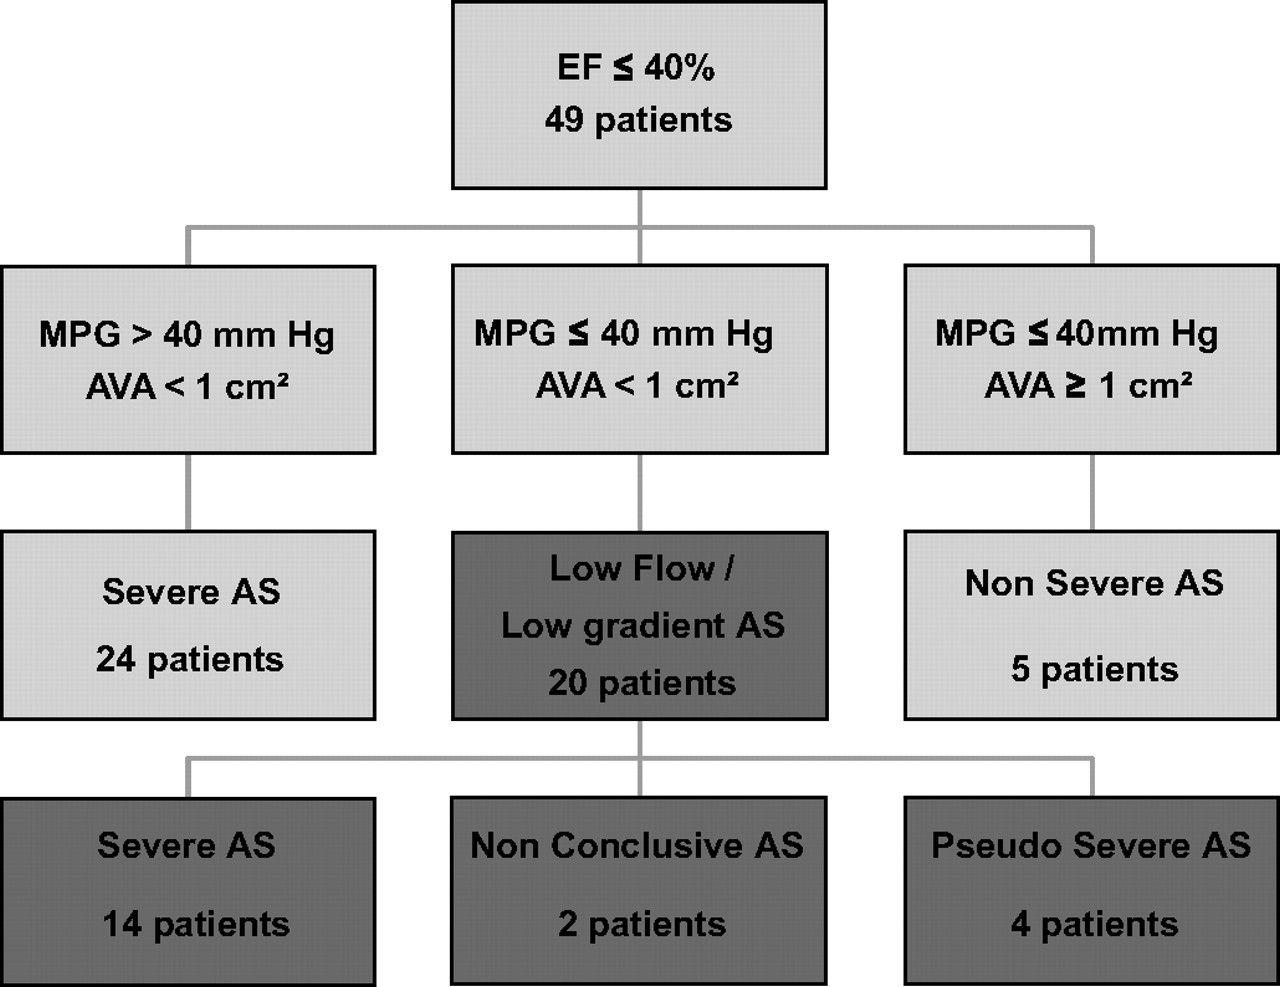
Forty-nine patients had an EF of 40% or less and were enrolled in the testing set. The mean EF was 30±7% (range 15–40%) and mean AVC 3265±1676 AU (median 3097, range 492–7120 AU). Among these 49 patients, 24 had an AVA less than 1 cm2 and a MPG greater than 40 mm Hg and were classified as having a severe AS, five patients had an AVA greater than 1 cm2 and a MPG of 40 mm Hg or less and were classified as non-severe AS and 20 patients had an AVA less than 1 cm2 and a MPG of 40 mm Hg or less (LF/LG AS) (figure 3). Patients with LF/LG AS were then classified as having severe or non-severe AS based on medical history (knowledge of high gradients before the index evaluation, N=8), or DSE (N=12). This assessment showed that among these 20 patients with LF/LG AS, 14 patients had severe AS, four patients pseudo-severe AS and two patients remained undetermined because of the absence of contractile reserve (figure 3).
Testing set. Flow chart of the patients with depressed ejection fraction (EF; <40%). AVA, aortic valve area; AS, aortic stenosis; MPG, mean pressure gradient.
Using a threshold of 1651 AU, all but three patients with depressed EF (including two patients with LF/LG AS) were correctly classified giving a sensitivity, specificity, negative-predictive value and positive-predictive value of 95%, 89%, 80% and 97%, respectively (table 3). Two patients with severe AS had a score less than 1651 (first patient AVA=0.55 cm2, MPG=43 mm Hg and AVC score 1206; second patient AVA=0.9 cm2, MPG=36 mm Hg and AVC score 1436) and one patient with a pseudo-severe AS had a score higher than 1651 AU (AVA=0.79 cm2, MPG=16 mm Hg and AVC score 1797 AU). Sensitivity, specificity, negative-predictive value and positive-predictive value in the LF/LG subgroup were similar to the entire testing set (93%, 75%, 75% and 93%, respectively; table 3). The use of different criteria for the definition of patients with LF/LG AS (EF ≤35% and MPG ≤30 mm Hg) did not change our results (13 patients with LF/LG AS and only one patient misclassified, AVA=0.79 cm2, MPG=16 mm Hg and AVC score1797 AU).
Diagnostic value of the 1651 AU threshold to correctly classified AS severity in the testing set using DSE as reference
Discussion
In this series of patients with AS, we observed a good correlation between the degree of AVC measured using MSCT and haemodynamic severity measured using TTE. The AUC of the ROC analysis for severe AS as defined by TTE was high, demonstrating the excellent diagnostic value of AVC measurements. In patients with depressed EF, the threshold of 1651 AU, which provided the best sum of sensitivity plus specificity in the validation set, accurately differentiated those with severe from those with non-severe AS. AVC measurement could thus be considered as an additional diagnostic tool for the assessment of AS severity especially in difficult cases such as patients with depressed EF.
Assessment of AS severity is an important step in the management of patients with AS.2–4 The clinical utility of measuring the stenosis severity is threefold: to ensure that the valve disease is the cause of the patient's symptoms, to predict reliably the optimal timing of valve replacement and to schedule the frequency of follow-up visits to the physician. Echocardiographic evaluation of AS severity is the reference method but may be technically challenging in patients with poor echocardiographic windows or in patients with depressed EF and LF/LG AS, underlining the need for complementary methods of AS assessment. Left ventricular catheterisation should be performed only in cases of discrepancies between clinical and echocardiographic evaluations2 and the crossing of the aortic valve is associated with a risk of cerebral embolism.16 Moreover, similar to echocardiography, invasive measurements at rest cannot discriminate severe from non-severe AS in the case of low cardiac output.
CT has recently emerged as a non-invasive complementary tool for the assessment of AS severity. A good correlation between the degree of AVC and AS haemodynamic severity has previously been reported.11 17–19 However, these studies are impeded by small sample sizes, non-simultaneous CT and echocardiographic performance, the use of EBCT (not available in France) instead of MSCT, or the absence of definition of clear thresholds for severe AS. In addition, no study had specifically evaluated the clinical usefulness of AVC measurements for the assessment of AS severity in patients with depressed EF.
The present study is the largest aimed at evaluating the relationship between the degree of AVC and AS haemodynamic severity using widely available 16-slice CT. A good correlation was observed between AVC and haemodynamic parameters either assessed using the valve area (absolute or indexed), the mean gradient or the peak velocity (coefficient of correlation between 0.63 and 0.79), and AUC of the ROC analysis for severe AS was excellent (between 0.86 and 0.92) demonstrating the good diagnostic value of AVC measurements. It is worth noting that its diagnostic value remained excellent despite the inclusion of 14% of patients in atrial fibrillation. An AVC score less than 700 AU excluded severe AS with high negative-predictive value, whereas a score above 2000 AU was highly suggestive of severe AS. A threshold of 1651 AU provided the best combination of sensitivity (80%) and specificity (87%). Interestingly, this threshold is higher than the one previously reported using EBCT (1200 AU) reinforcing the need for the validation of thresholds that are specific to the technique used.
The diagnostic value of this threshold was then tested in an independent subset of patients with depressed EF and low gradient, who often constitute a challenge for echocardiographic evaluation and management especially in the case of low cardiac output. In those patients, the low cardiac output reduces the valve opening and thus mildly stenotic valves may have limited mobility, which results in small AVA either calculated using the continuity equation or obtained by planimetry. Patients with LF/LG AS are not uncommon and such sick patients are going to be more frequently referred for evaluation with the development of less invasive treatment (transcatheter aortic valve implantation). Resting TTE cannot differentiate pseudo-severe AS (non-severe AS with primitive left ventricular dysfunction) from severe AS with secondary left ventricular dysfunction and diagnosis is often made by DSE.12 20 In the present study, all but three patients with depressed EF were correctly classified using the threshold of 1651. The three misclassified patients had AVC scores close to this threshold, which should be considered as a grey zone.
The present study may have important clinical implications. AVC measurement is a simple, fast, non-invasive, highly feasible, widely available and reproducible technique. It is, by nature, a flow-independent method. It can be performed in patients in atrial fibrillation, does not require any contrast injection or withdrawing β-blocker therapy and therefore does not present any side-effect. The irradiation dose is low and is less of an issue in this elderly population. With regard to our results, AVC measurement using MSCT should be considered an additional tool for the evaluation of AS severity in difficult cases such as patients with poor echocardiographic windows or with LF/LG. It is important to underline that in this last subgroup, CT and DSE should not be regarded as competitive but complementary methods. DSE is crucial for risk stratification and the presence of contractile reserve is an important prognostic factor. However, realisation and interpretation of DSE can sometimes be challenging justifying complementary methods. DSE cannot differentiate severe AS from pseudo-severe AS in a substantial number of patients because of the absence of contractile reserve.8 10 On the other hand, an AVC score in the grey zone close to 1651 AU may benefit from additional confirmation. With regard to the high operative risk of those patients, it seems reasonable to corroborate AS severity by two different methods. In addition, CT—with iodine contrast injection—is crucial in the work-up of patients referred for transcatheter aortic valvular implantation21 and can be combined with AVC measurements. Finally, patients with paradoxical low flow and preserved EF are a recently described entity22 in which AVC may also be of interest but deserves further investigation.
The present study deserves several comments. First, the number of patients with LF/LG AS is relatively low. However, to the best of our knowledge, this is the only study aimed at evaluating the diagnostic value of AVC measurements in this subset of patients, and the threshold used in this analysis was determined in a large series of patients with AS. In addition, our proportion of pseudo-severe AS (20%) is consistent with that reported in a recent study including a larger number of patients (27%).23 Second, the AVC score may be dependent on the CT system used. Our threshold, established with a 16-slice CT, may not be automatically transferred to modern CT such as dual-source CT and deserves further validation. Third, artifacts due to pacemakers can preclude AVC measurements and this is a limitation of the method. However, in some patients, depending on the position of the leads, AVC can still be measured and with technological improvement the rate of artifacts due to pacemakers is expected to be significantly reduced. Fourth, as shown in figure 1, there was some degree of scattering of AVA for a given AVC score. AVC is closely related but not identical to AVA, which may explain its independent prognostic value.11 24 Finally, DSE is considered the gold-standard method for the evaluation of patients with LF/LG AS. Comparison of the prognostic value of the degree of AVC and DSE could not be evaluated in the present study and deserves further evaluation in outcome studies.
Conclusion
In a large series of patients with a wide range of AS severity we demonstrated that the degree of AVC is closely correlated to AS haemodynamic parameters and had an excellent diagnostic value. MSCT should thus be considered as an additional tool for the evaluation of AS severity especially in difficult cases such as patients with poor echocardiographic windows or with depressed EF.
References
Footnotes
Funding CC was supported by a grant from the Fédération Française de Cardiologie, DM-Z was supported by a contrat d'interface INSERM. The COFRASA and GENERAC studies are supported by a grant from the Assistance Publique, Hôpitaux de Paris (PHRC national 2005 and PHRC regional 2007, respectively).
Competing interests AV and DH are consultants for Edwards Lifesciences. BI received speaker's fees from Edwards Lifesciences and Sanofi-Aventis.
Patient consent Obtained.
Ethics approval This study was conducted with the approval of the Comité de Protection des Personnes, Hotel-Dieu Paris, France.
Provenance and peer review Not commissioned; externally peer reviewed.