Article Text

Abstract
Objective To quantify right ventriculo-arterial coupling in pulmonary hypertension by combining standard right heart catheterisation (RHC) and cardiac magnetic resonance (CMR) and to estimate it non-invasively with CMR alone.
Design Cross-sectional analysis in a retrospective cohort of consecutive patients.
Setting Tertiary care centre.
Patients 139 adults referred for pulmonary hypertension evaluation.
Interventions CMR and RHC within 2 days (n=151 test pairs).
Main outcome measures Right ventriculo-arterial coupling was quantified as the ratio of pulmonary artery (PA) effective elastance (Ea, index of arterial load) to right ventricular maximal end-systolic elastance (Emax, index of contractility). Right ventricular end-systolic volume (ESV) and stroke volume (SV) were obtained from CMR and adjusted to body surface area. RHC provided mean PA pressure (mPAP) as a surrogate of right ventricular end-systolic pressure, pulmonary capillary wedge pressure (PCWP) and pulmonary vascular resistance index (PVRI). Ea was calculated as (mPAP − PCWP)/SV and Emax as mPAP/ESV.
Results Ea increased linearly with advancing severity as defined by PVRI quartiles (0.19, 0.50, 0.93 and 1.63 mm Hg/ml/m2, respectively; p<0.001 for trend) whereas Emax increased initially and subsequently tended to decrease (0.52, 0.67, 0.54 and 0.56 mm Hg/ml/m2; p=0.7). Ea/Emax was maintained early but increased markedly with severe hypertension (0.35, 0.72, 1.76 and 2.85; p<0.001), indicating uncoupling. Ea/Emax approximated non-invasively with CMR as ESV/SV was 0.75, 1.17, 2.28 and 3.51, respectively (p<0.001).
Conclusions Right ventriculo-arterial coupling in pulmonary hypertension can be studied with standard RHC and CMR. Arterial load increases with disease severity whereas contractility cannot progress in parallel, leading to severe uncoupling.
- Primary pulmonary hypertension
- imaging/CT MRI
- CT scanning
- MRI
- pulmonary vascular disease
- EBM
- STEMI
- stable angina
- NSTEMI
- coronary artery disease (CAD)
Statistics from Altmetric.com
- Primary pulmonary hypertension
- imaging/CT MRI
- CT scanning
- MRI
- pulmonary vascular disease
- EBM
- STEMI
- stable angina
- NSTEMI
- coronary artery disease (CAD)
Key questions
What is the key question?
Can right ventriculo-arterial coupling be quantified from standard haemodynamic and imaging indices in pulmonary hypertension?
What is the bottom line?
Abnormal right ventriculo-arterial coupling is a major determinant of right heart failure, in turn the main cause of death in pulmonary hypertension.
Why read on?
We present a simple method for quantification of right ventriculo-arterial coupling that can be applied in the clinical setting and that demonstrates the predicted changes in coupling with increasing severity of pulmonary hypertension.
Introduction
Right heart failure is the main cause of death in pulmonary hypertension.1 The presence and severity of right ventricular failure is usually established clinically through physical examination as well as through haemodynamic or echocardiographic indexes.2 3 More recently, cardiac magnetic resonance (CMR) has emerged as a promising diagnostic and prognostic modality in pulmonary hypertension, particularly because of the ability to accurately evaluate right ventricular status and pulmonary artery (PA) flow.4–8 Preliminary data suggest that reduced right ventricular stroke volume (SV) or increased biventricular end-diastolic volumes using CMR are associated with impaired outcome in pulmonary arterial hypertension.7
Although useful in practice, quantification of ventricular volumes or ejection fraction only provides a limited view of cardiovascular adaptation to pressure overload. A more comprehensive understanding can be achieved by simultaneous consideration of both ventricular performance and arterial load, and the degree of matching between the two. It can be predicted that, in early stages of disease, ventricular function and load are adequately coupled and heart failure is prevented whereas, as load continues to increase, the ventricle is unable to proportionally enhance its contractility and eventually fails.9 10 Quantification of ventriculo-arterial coupling usually requires complex invasive measurements with conductance catheters and varying loading conditions which precludes its application in clinical practice.10–14 We hypothesised that: (1) right ventriculo-arterial coupling can be assessed with common right heart catheterisation (RHC) parameters and CMR-derived indexes; (2) right ventriculo-arterial coupling can be non-invasively approximated with CMR alone; and (3) abnormalities in right ventriculo-arterial coupling at different stages of pulmonary hypertension can be characterised with these approaches.
Methods
Theoretical background and ventriculo-arterial coupling calculation
Elastance, the change in pressure for a given change in volume, is a property that describes an elastic chamber.9 Maximal systolic ventricular elastance (Emax) is a load-independent parameter that has been widely employed for the characterisation of ventricular contractility.12 15–19 Conversely, effective arterial elastance (Ea) is an index of the load faced by the ventricle that incorporates vascular resistance, compliance, impedance and systolic and diastolic time intervals.12 20 Optimal ventriculo-arterial coupling takes place when there is maximal transference of potential energy from one elastic chamber (the ventricle) to another (the arterial system), and this occurs if both elastances are equal. The ratio Ea/Emax can therefore be used as an index of ventriculo-arterial coupling.12 13
Emax occurs at end-systole (at or near the end of ejection) and is typically calculated by the formula:
Similarly, ESP can be approximated by using mean arterial pressure12 17 20 25 26 so, for the right ventricle, equation 2 becomes:
Regarding arterial load, Ea can be represented as the slope of the arterial ESP versus SV relationship in the volume–pressure loop and is typically calculated as11 12 20:
When quantifying Ea, downstream pressure is often ignored in the systemic circulation because it is small; however, in the pulmonary circulation, pulmonary capillary wedge pressure (PCWP) may not be negligible. Thus, equation 4 becomes26:
Population
Consecutive patients clinically referred for the evaluation of known or suspected pulmonary hypertension and who underwent RHC and CMR within 2 days were included in the study. A total of 143 patients were retrospectively identified; after exclusion of one patient with a final diagnosis of pulmonary valve stenosis, another with a functional single ventricle and two patients with missing phase contrast (flow) images of the PA, a final sample of 139 patients was included with a total of 151 CMR-RHC combinations. The underlying diseases responsible for the established or presumed diagnosis of pulmonary hypertension were determined after comprehensive diagnostic evaluation,1 and pulmonary hypertension aetiology was categorised according to the recently revised WHO classification.29 The Institutional Review Board approved the study with a waiver of informed consent, and all individuals consented to the procedures.
Cardiac magnetic resonance
CMR studies were performed either with 1.5 Tesla (Magnetom Sonata, Siemens Medical Solutions, Erlangen, Germany, n=148) or 3.0 Tesla (Achieva, Philips Medical Systems, Best, The Netherlands, n=3) magnets using dedicated surface coils and retrospective ECG gating. For cine imaging of the right ventricle, a steady-state free precession sequence was employed as previously described.30 Briefly, multiple short-axis views were acquired during limited periods of apnoea covering the ventricles from base to apex, and reconstructed into 25 cardiac phases each for the evaluation of ventricular volumes and function. In addition, flow imaging was performed perpendicular to the pulmonary trunk with a velocity-encoded gradient echo sequence, also as reported previously.6
CMR images were analysed using specialised software (Argus, Siemens Medical Solutions). On cine images, right ventricular endocardial contours were traced in end-diastole and end-systole to derive end-diastolic volume, ESV and ejection fraction.30 Similarly, the inner contours of the main PA cross-section were outlined in each cardiac phase and, through integration of PA areas and flow, the anterograde right ventricular SV was quantified.6 The reproducibility of these measurements is known to be high.6 31 Both ESV and SV were adjusted by body surface area to account for differences in patient size.
Right heart catheterisation
RHC was performed using a Swan-Ganz catheter introduced via femoral or internal jugular approach and employing standard methodology. Haemodynamic measurements included mean right atrial pressure, systolic and diastolic PA pressures, mPAP, PCWP, cardiac index (calculated as cardiac output obtained by thermodilution divided by body surface area) and pulmonary vascular resistance index (PVRI; calculated as the difference between mPAP and PCWP divided by the cardiac index). The presence of pulmonary hypertension was defined as mPAP ≥25 mm Hg.1 2
Statistical analysis
Departures from normality in the variable distributions were detected with the Shapiro–Wilk statistic. Categorical values are expressed as absolute number (percentage) and continuous variables as median (IQR). Differences between patients with and without pulmonary hypertension were evaluated with the χ2 and Mann–Whitney U tests. Relations between demographic, RHC and CMR data with ventriculo-arterial coupling indices were explored using Spearman ρ (r) coefficients and bivariate regression analysis. In order to evaluate changes in ventriculo-arterial coupling with disease severity, we divided the sample into four groups according to PVRI quartiles. Ventriculo-arterial coupling indices were then compared using the Kruskal–Wallis test and Wilcoxon rank sum test with Bonferroni correction for post hoc comparisons, and tested for linear trends with the Jonckheere–Terpstra statistic. For the evaluation of a possible influence of the underlying aetiology on ventriculo-arterial coupling, multivariate regression analysis was performed adjusting for age, gender and PVRI. For this purpose, the aetiology of pulmonary hypertension was divided into four dummy variables and pulmonary arterial hypertension was considered the reference category. In addition, to explore the potential of ventriculo-arterial coupling indices for serial evaluation, we compared baseline and follow-up data with the Wilcoxon rank sum test for paired data in patients with two pairs of studies. All tests were two-tailed and a p value <0.05 was considered statistically significant. Statistical analyses were performed with SPSS Version 15.0 and Microsoft Excel 2003.
Results
Clinical, RHC, CMR and elastance data are summarised in table 1.
Clinical, haemodynamic, CMR and ventriculo-arterial coupling data
There were no differences in age (p=0.91), gender (p=0.43), body surface area (p=0.71) or aetiology distribution (p=0.08) between patients with or without pulmonary hypertension. As expected, haemodynamic parameters and right ventricular status were impaired in pulmonary hypertension. Similarly, Ea, Emax and their ratio were higher in the presence of pulmonary hypertension. There were weak correlations between age and Ea (r=−0.20; p=0.02), Emax (r=0.24; p=0.003) and Ea/Emax (r=−0.28; p=0.001); however, when restricted to patients with no pulmonary hypertension, these correlations were no longer significant. No gender-based differences were noted in ventriculo-arterial coupling parameters (data not shown).
As shown in figure 1, Ea increased linearly with advancing severity (p<0.001 for trend). On the other hand, Emax increased initially but did not progress further and tended to decrease in more advanced stages (p=0.7 for trend). As a consequence, ventriculo-arterial coupling (Ea/Emax) was relatively maintained in earlier stages but increased markedly with more severe pulmonary hypertension (p≤0.001 for trend). Ea/Emax correlated negatively with right ventricular ejection fraction (r=−0.86) and positively with mPAP and PVRI (r=0.62 and 0.80, respectively; p<0.001 for all). Figure 2 shows these relationships to be curvilinear. The correlations between Ea/Emax and PVRI were similar in patients in whom the CMR and RHC were performed on the same day (n=101, r=0.81, p<0.001) and in those in whom the tests were performed on different days (n=50, r=0.76, p<0.001). According to underlying aetiologies and after adjustment for age, gender and PVRI, there were no significant differences between groups in Ea/Emax (p=0.99; see table 1 in online supplement). Moreover, in order to unmask potential influences of interventricular interaction on right ventriculo-arterial coupling, we performed a subanalysis excluding patients with pulmonary hypertension secondary to left heart disease (n=37). The values and patterns of Ea, Emax and Ea/Emax distributions remained similar to those of the whole group (see table 2 in online supplement).

Median values of (A) effective pulmonary arterial elastance (Ea), (B) right ventricular maximal systolic elastance (Emax) and (C) Ea/Emax across quartiles (Q1–Q4) of pulmonary vascular resistance index (PVRI). Cut-off values for PVRI quartiles are 4.3, 8.3 and 14.4 Wood units × m2. Error bars represent IQR. NS, not significant.

Correlations between the ratio of effective pulmonary arterial elastance to right ventricular maximal systolic elastance (Ea/Emax) and (A) right ventricular ejection fraction (RVEF), (B) mean pulmonary artery pressure (mPAP) and (C) pulmonary vascular resistance index (PVRI).
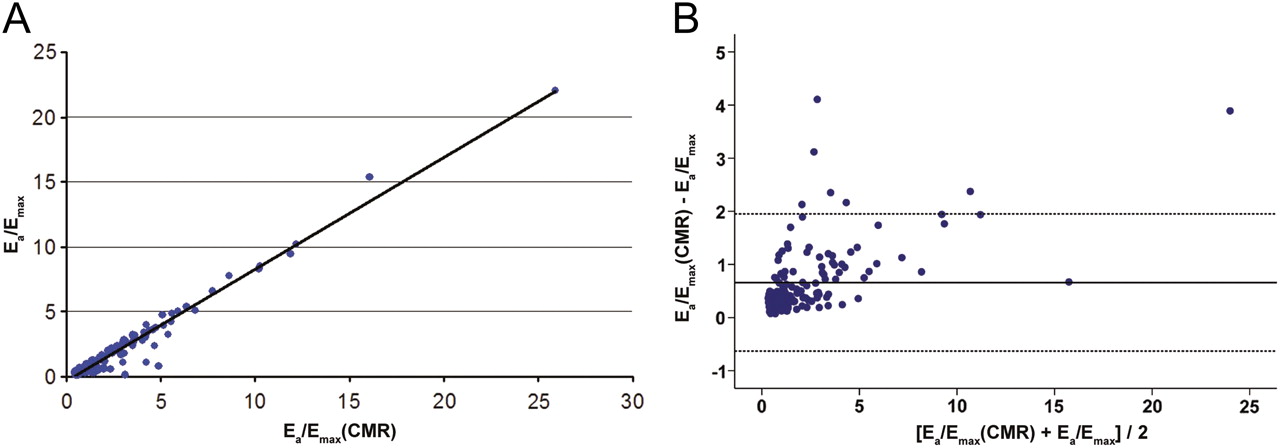
Regarding non-invasive evaluation of ventriculo-arterial coupling, Ea/Emax (CMR) showed excellent correlation (r=0.93, p<0.001) and good agreement with Ea/Emax (figure 3). As expected, CMR systematically overestimated Ea/Emax by an average of 0.66±0.66. Nonetheless, Ea/Emax (CMR) demonstrated equivalent patterns of progression in ventriculo-arterial coupling across disease stages (p≤0.001 for trend, figure 4).

(A) Correlation between the ratio of effective pulmonary arterial elastance to right ventricular maximal systolic elastance (Ea/Emax) and the cardiac magnetic resonance (CMR)-based ratio (Ea/Emax (CMR)). (B) Bland–Altman plot of agreement between Ea/Emax and Ea/Emax (CMR).

Median values of the cardiac magnetic resonance (CMR)-based ratio of effective pulmonary arterial elastance to right ventricular maximal systolic elastance (Ea/Emax (CMR)) across quartiles (Q1–Q4) of pulmonary vascular resistance index (PVRI). Cut-off values for PVRI quartiles are 4.3, 8.3 and 14.4 Wood units × m2. Error bars represent IQR.
We also evaluated the associations of ventriculo-arterial coupling parameters with right atrial pressure and cardiac index, two well-described markers of outcome in pulmonary hypertension.3 As expected, there were significant correlations between most of these variables (table 2). On multivariate analysis, Emax and Ea/Emax (CMR) remained independently associated with right atrial pressure after adjustment for PVRI (β=−2.81 and β=0.22; p<0.05 for both).
Correlations of ventriculo-arterial coupling indices with right atrial pressure and cardiac index
Finally, we explored serial changes in eight patients who underwent more than one RHC-CMR combination (interval between baseline and follow-up 324±295 days). During this time mPAP decreased significantly. This was associated with a significant reduction in Emax while right ventricular ejection fraction, Ea and Ea/Emax did not change significantly (table 3).
Serial changes in patients with repeated evaluations (N=8)
Discussion
This study describes a novel method for the quantification of right ventriculo-arterial coupling with simple indices derived from standard RHC and CMR. Moreover, a further simplification using only CMR measurements can approximate ventriculo-arterial coupling in a completely non-invasive fashion. A previous study in six patients with pulmonary hypertension using CMR-compatible catheters validated invasive ventriculo-arterial coupling determinations using CMR-derived volume data.14 To the best of our knowledge, ours is the first description of right ventriculo-arterial coupling in a large series of patients with pulmonary hypertension of a wide range of severity.
Our findings matched theoretical predictions and limited experimental observations regarding right-sided Ea, Emax and Ea/Emax. We found median Ea values of 0.16 mm Hg/ml/m2 (or 0.1 mm Hg/ml) in individuals with normal PA pressures. This is in good agreement with previously reported invasive determinations of 0.6±0.3 mm Hg/ml.14 Similarly, normal human right ventricular Emax values are not well established and have been reported as 0.84±0.32 mm Hg/ml/m2 or 0.3±0.19 mm Hg/ml/m2.18 32 These values also correspond well with our median of 0.47 mm Hg/ml/m2 in the absence of pulmonary hypertension. As a result, we found normal values of 0.37 (0.34) for the Ea/Emax ratio, which again agrees with previously reported values in dogs10 21 or humans.14 At optimal coupling (ratio=1) the right ventricle is able to generate maximal flow with minimal energy loss. Conversely, maximal efficiency occurs when stroke work is maximal and oxygen consumption minimal.10 The right heart circulation is near optimally matched in normal conditions.17 33 In this situation, the right ventricle operates at maximal efficiency and submaximal stroke work (Ea<Emax). During acute pulmonary hypertension and, as seen in this investigation, in early phases of chronic pulmonary hypertension, contractility augments to match increased load and to maintain the SV, preserving optimal coupling (Ea=Emax) at the expense of suboptimal mechanical efficiency (which would cause increased oxygen consumption).10 Eventually, the right ventricle fails as a pump with a decrease in Emax and a large increase in Ea/Emax that indicates inadequate coupling and reduced myocardial efficiency.9 10 34 Our study confirms these predictions, as we observed progressive increases in Ea, early increases in Emax with subsequent stabilisation and a trend for fall, and initially maintained coupling with a dramatic mismatch in advanced stages (figure 1). Importantly, these patterns seem to occur regardless of the underlying aetiology of pulmonary hypertension, including left heart disease. The mPAP at which the right ventricle fails acutely has been described as 30–40 mm Hg.10 35 In chronic pulmonary hypertension, based on our findings, ventriculo-arterial coupling was maintained within normal limits up to similar mPAP levels and to PVRI values in the vicinity of 10 Wood Units × m2 (figure 2B,C).
Adequate ventriculo-arterial coupling is largely dependent on PA compliance.36 37 We have previously reported early and marked increases in PA stiffness in pulmonary hypertension38 that probably contribute to abnormal ventriculo-arterial coupling even with relatively low PVRI values. The initial elevations in Emax probably reflect the enhanced right ventricular contractility in the face of augmented load (both steady and pulsatile), with subsequent inability to increase further. As shown in figure 2A, ejection fraction is intimately related to arterial and ventricular elastances.13 24 28 The advantage of assessing Ea and Emax over ejection fraction is improved discrimination of changes in ventricular performance, arterial load or both.9 This is also suggested from the findings in patients with repeated studies (table 2), although determination of potential prognostic significance or value for serial evaluation will require further research. However, whereas acute changes in Emax seem to reliably reflect changes in contractility, baseline Emax probably integrates both contractility and geometrical/structural ventricular properties.9 Thus, it remains to be determined whether this approach would be useful to evaluate acute changes in coupling (ie, with pharmacological interventions). Emax and Ea/Emax (CMR) also demonstrated an independent association with right atrial pressure, a well-known predictor of outcome in pulmonary hypertension,3 although it should be noted that these associations were weak and are probably modulated by underlying treatment.
Regarding the evaluation of ventriculo-arterial coupling in a completely non-invasive fashion with CMR, we found good agreement with measurements derived from pressures, although with an expected systematic overestimation of Ea/Emax. Furthermore, the patterns of Ea/Emax in different disease stages closely matched those observed with the initial method. The simplified ESV/SV ratio as an index of ventriculo-arterial coupling implies that, at optimal coupling, SV is 50% of the effective preload and equal to ESV or, in other words, that ejection fraction should be 50%. Indeed, this is in the vicinity of normal right ventricular ejection fraction,39 and these relations have also been predicted based on theoretical considerations.12 Moreover, ESV alone has been described as a reasonable reflection of contractile state.16
Limitations of the study
The method employed in this work relies on a number of assumptions, particularly for the calculation of Emax. Human right ventricular V0 is 8±12 ml/m2 in normal individuals.18 Thus, our calculated Emax probably overestimates the true value as it neglects V0.22 28 In the right ventricle, end-systole (defined as the time of maximal elastance) precedes end of ejection.17 18 Thus, end-ejection volume (used as ESV in this investigation) is slightly smaller than true end-systolic volume (defined as time of maximal elastance) but only by 2±2 ml/m2 in the normal human right ventricle.18 Moreover, this difference correlates negatively with resistance/pressures, so it is smaller in the presence of pulmonary hypertension.13 18 Similarly, there is more discrepancy in mPAP and ESP in the pulmonary circulation than in the systemic circulation, but this is less pronounced in pulmonary hypertension.17 26 Finally, pressures and volumes were not determined simultaneously. Despite these assumptions, the facts that our results were comparable to those obtained invasively and that ventriculo-arterial coupling followed the predicted patterns with increasing pulmonary hypertension severity suggest that our method constitutes a valid framework for the study of right ventriculo-arterial coupling in pulmonary hypertension. We included patients with a variety of pulmonary hypertension aetiologies and this undoubtedly introduced heterogeneity into the study sample. Although we found no differences in ventriculo-arterial coupling across the main five aetiological groups when adjusting for PVRI, it is likely that differences exist among subgroups that would require further evaluation in studies restricted to specific aetiologies.
Conclusions
Right ventriculo-arterial coupling in pulmonary hypertension can be determined by combining standard RHC and CMR measurements and can be approximated (at the expense of a some systematic overestimation) with CMR alone. In the early stages of pulmonary hypertension, ventriculo-arterial coupling is relatively preserved through an increase in right ventricular contractility. In more advanced phases the combination of increasing arterial load and failing right ventricle leads to large ventriculo-arterial mismatch. Evaluation of ventriculo-arterial coupling may help to elucidate the mechanisms of right ventricular failure and may also help to identify patients at risk or guide the timing of therapeutic interventions in pulmonary hypertension.
References
Supplementary materials
Supplementary Data
This web only file has been produced by the BMJ Publishing Group from an electronic file supplied by the author(s) and has not been edited for content.
Files in this Data Supplement:
- Data Supplement - Manuscript file of format pdf
Footnotes
Funding This work was partially supported by the Centro Nacional de Investigaciones Cardiovasculares (CNIC), Madrid, Spain (CARDIOJOVEN Program to AG-A and CARDIOIMAGEN to JGM); Instituto de Formación e Investigación “Marqués de Valdecilla”, Santander, Spain (PostMIR Wenceslao López Albo grant to LF-F) and the SPANISH Society of Cardiology (Post-Residency Grant to LF-F and AG-A).
Competing interests None.
Ethics approval This study was conducted with the approval of the Institutional Review Board.
Provenance and peer review Not commissioned; externally peer reviewed.