Article Text

Abstract
Objective Current guidelines define severe aortic stenosis (AS) as an aortic valve area (AVA)≤1.0 cm2, but some authors have suggested that the AVA cut-off be decreased to 0.8 cm2. The aim of this study was, therefore, to better describe the clinical features and prognosis of patients with an AVA of 0.8–0.99 cm2.
Methods Patients with isolated, severe AS and ejection fraction ≥55% with an AVA of 0.8–0.99 cm2 (n=105) were compared with those with an AVA<0.8 cm2 (n=155) and 1.0–1.3 cm2 (n=81). The endpoint of this study was a combination of death from any cause or aortic valve replacement at or before 3 years.
Results Patients with an AVA of 0.8–0.99 cm2 group comprised predominantly normal-flow, low-gradient (NFLG) AS, while high gradients and low flow were more often observed with an AVA<0.8 cm2. The frequency of symptoms was not significantly different between an AVA of 0.8–0.99 cm2 and 1.0–1.3 cm2. The combined endpoint was achieved in 71%, 52% and 21% of patients with an AVA of 0.8 cm2, 0.8–0.99 cm2and 1.0–1.3 cm2, respectively (p<0.001). Among patients with an AVA of 0.8–0.99 cm2, NFLG AS was associated with a lower hazard (HR=0.40, 95% CI 0.23 to 0.68, p=0.001) of achieving the combined endpoint with outcomes similar to moderate AS in the first 1.5 years of follow-up. Patients with high-gradient or low-flow AS with an AVA of 0.8–0.99 cm2 had outcomes similar to those with an AVA<0.8 cm2. The sensitivity for the combined endpoint was 61% for an AVA cut-off of 0.8 cm2 and 91% for a cut-off of 1.0 cm2.
Conclusions The outcomes of patients with AS with an AVA of 0.8–0.99 cm2 are variable and are more precisely defined by flow-gradient status. Our findings support the current AVA cut-off of 1.0 cm2.
- aortic stenosis
- valve disease surgery
Statistics from Altmetric.com
Introduction
Severe aortic stenosis (AS) is defined as a peak velocity (Vp)>4.0 m/s (or mean gradient (MG)>40 mm Hg) and an aortic valve area (AVA)<1.0 cm2 (by European guidelines) or ≤1.0 cm2 (by American guidelines).1 2 In accordance with these guidelines, a Vp>4.0 m/s has been repeatedly demonstrated to be a predictor of worse prognosis in patients with severe AS.3–5 However, many patients with AS with preserved systolic function have discordant parameters of stenosis severity with an AVA<1.0 cm2 but Vp<4.0 m/s or MG<40 mm Hg.6–8
The continuity equation-derived AVA, however, is widely used to define AS severity, but the association between AVA and prognosis in AS has not been robust in earlier studies.3–5 9 More recent reports have shown that an AVA<1.0 cm2 is independently associated with worse long-term outcomes.10 11 Therefore, the prognosis and management of patients with AS with ‘low-gradient, severe AS,’ who have AVA<1.0 cm2 but Vp<4.0 m/s (or MG<40 mm Hg) with preserved left ventricular (LV) function, continues to result in significant uncertainty for clinicians.
Some authors have suggested that the AVA cut-off for severe AS be lowered to 0.8 cm2, which better corresponds to a Vp of 4.0 m/s and MG of 40 mm Hg.6 However, it remains unclear if those patients who might be reclassified as moderate AS by such a change (ie, patients with AVA of 0.8–0.99 cm2), who fall in a ‘gray zone’ of AS severity,12 have the same prognosis as patients with an AVA<0.8 cm2. We used an existing database of patients with AS at our institution to compare the clinical, LV and haemodynamic characteristics of patients with AS with an AVA of 0.8–0.99 cm2 and compare this group to those with definite severe AS (defined as AVA<0.8 cm2) and moderate AS. Second, we determined the prevalence of recently described flow-gradient subtypes13 in each of the two AVA groups <1.0 cm2. Lastly, we sought to further describe the outcomes of these AVA groups, and in particular those with an AVA between 0.8 and 0.99 cm2 whose outcomes as a group have not yet been clearly defined.
Methods
Patient population
A retrospective search of our echocardiographic database was performed from January through December 2008 for patients with severe AS (AVA<1.0 cm2) and normal LV systolic function (defined as ejection fraction ≥55%) and wall motion. Those with greater than mild aortic regurgitation or mitral valve disease, intracavitary gradient and technically difficult studies were excluded. From the 260 patients identified, patients were then divided by AVA into two groups: AVA<0.8 cm2 and AVA between 0.8 and 0.99 cm2. Both groups were compared with a reference group of 81 patients from the same database with moderate AS (defined as AVA 1.0–1.3 cm2) and normal LV function. Patients with moderate AS were consecutively selected and met the same exclusion criteria as the severe AS groups. Symptoms were evaluated for each patient by review of medical records at the time of the index echocardiogram.
In the current study, 113 of 260 patients with severe AS and 75 of 81 patients with moderate AS overlapped with a prior publication from the existing AS database at our institution7; the remaining 153 patients have not been previously reported. Overlap primarily exists in the aggregate clinical and echocardiographic data presented in the moderate AS group which was used as a reference group; however, we used nearly the same moderate AS cohort from the same year so that our data and comparisons would not be affected by varying temporal trends in aortic valve replacement (AVR). The aims of this work, specific categorisation of AS groups for patients with severe AS based on AVA (and the aggregate clinical and echocardiographic data in these groups), the combined outcome studied (death and AVR), statistical analyses performed and conclusions derived from this patient cohort, are unique to this study. Our institutional review board approved this study.
Echocardiography
Assessment of AS severity, LV ejection fraction by biplane Simpson’s method, endocardial and mid-wall shortening, relative wall thickness and LV mass to end-diastolic volume ratio were performed according to current guidelines.14 15 Longitudinal systolic function was assessed by pulsed tissue Doppler-derived peak systolic septal and lateral mitral annular velocities. LV diastolic function was assessed by mitral inflow and tissue Doppler annular velocities, pulmonary arterial systolic pressure and left atrial volume.
Flow-gradient analysis
The stroke volume index (SVi) was calculated as the product of the LV outflow tract cross-sectional area and velocity-time integral indexed to body surface area, and also calculated using volumetric methods as end-diastolic minus the end-systolic volume index. Low flow was defined as Doppler-derived SVi<35 mL/m2, while low gradient was defined as MG<40 mm Hg.13 16
Outcomes analysis
The primary outcome was a combined endpoint of death from any cause or AVR at or before 3 years. The decision for AVR was determined under the guidance of each patient’s physician. Patients who underwent either transcatheter or surgical AVR were considered as having met the study endpoint. The primary outcome was also determined in all patients according to current transaortic Vp and MG cut-offs for mild, moderate and severe AS.14 Because AVR was considered a predefined endpoint, the existing database of patients with AS from 2008 with outcome data collected in 2012 (after 3 years of follow-up) was used to better study the natural history of AS prior to the routine use of transcatheter AVR. With the emergence of transcatheter AVR, therapeutic options for severe AS have significantly increased; therefore, use of a contemporary data set would result in a largely heterogeneous AVR endpoint with overall lower rates of death. Outcome data were complete for all patients and were obtained from review of medical records and the Social Security Death Index.
Statistical analysis
Variables are expressed as mean±SD or median (25th–75th percentiles) where appropriate. Continuous variables were compared with the one-way analysis of variance test, Mann-Whitney U test and Kruskal-Wallis test where appropriate; post hoc pairwise comparisons were made with Scheffe or Dunn-Bonferroni tests. Categorical variables were compared with the Fisher’s exact test. A p value <0.05 was considered statistically significant. Spearman correlation coefficients were used to describe the linear relationship between AVA and SVi. Time-to-event curves were generated using Kaplan-Meier estimates to depict outcomes between the groups analysed with differences assessed with the log-rank test. Cox proportional hazards analysis was performed to determine the independent predictors of the primary outcome for patients with an AVA of 0.8–0.99 cm2. A single candidate variable was selected from each of several domains if applicable (clinical, LV geometry, transvalvular flow and valve severity) to avoid collinearity and then entered into the final model. Unique, clinically relevant and previously validated predictor variables with a p value <0.10 in univariate analysis were entered into final multivariable models; a forward covariate selection procedure was used. The proportional hazards assumption was tested with the use of log-log plots and examination of Schoenfeld residuals. All analyses were performed with SPSS V.18.0.
Results
Baseline characteristics for three AVA groups are shown in table 1. Patients with an AVA<0.8 cm2 were more likely to have a history of congestive heart failure and be symptomatic compared with those with an AVA between 0.8 and 0.99 cm2 and those with moderate AS. The frequency of symptoms was not different between patients with an AVA of 0.8–0.99 cm2 and moderate AS.
Baseline characteristics and symptoms
AS severity and transvalvular flow
Parameters of AS severity and transvalvular flow are shown in table 2 and according to symptom status in figure 1. Patients with an AVA between 0.8 and 0.99 cm2 had an MG, Vp and velocity index which were intermediate between AVA<0.8 cm2 and AVA 1.0–1.3 cm2 but not considered to be in the severe range by current guidelines.1 2 14 Sixty-three per cent of patients with an AVA between 0.8 and 0.99 cm2 had a Vp<4.0 m/s, and 71% had an MG<40 mm Hg. Multiple parameters of transvalvular flow were lowest in patients with an AVA<0.8 cm2 but not different between the remaining two AVA groups (table 2). There was also a weak but significant correlation (r=0.25, p<0.001) between SVi and AVA (figure 2).
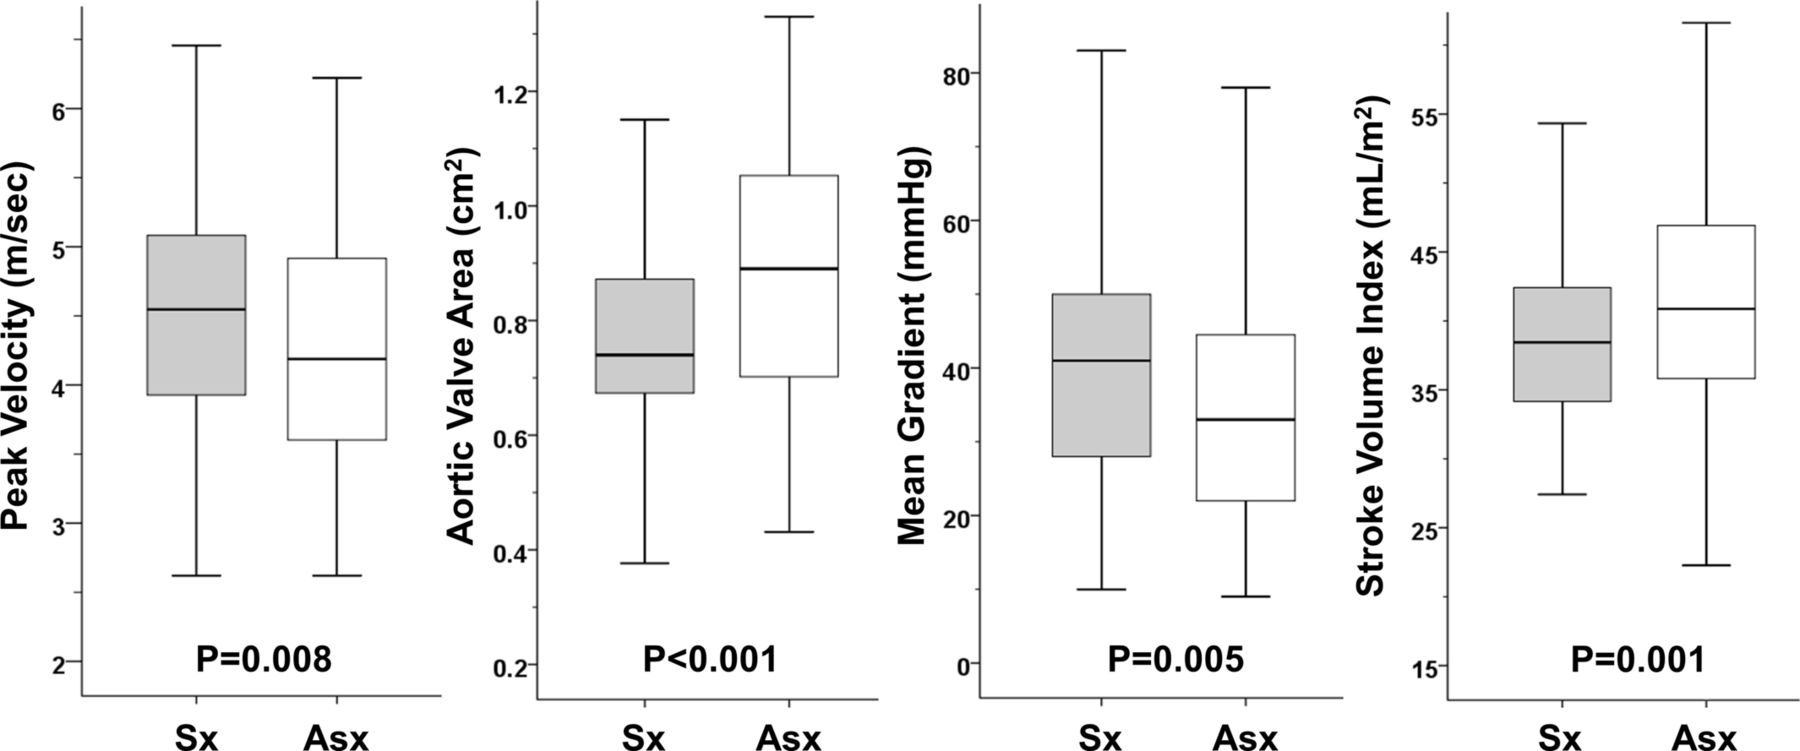
Box plots of parameters of aortic stenosis severity and transvalvular flow according to symptom status. Asx, asymptomatic; Sx, symptomatic.

Scatter plot of stroke volume index and AVA. AVA, aortic valve area; HG, high gradient; LFLG, low flow, low gradient; NFLG, normal flow, low gradient.
Aortic stenosis severity and transvalvular flow
Flow-gradient AS subtypes
The presence of high-gradient (HG) (76%) and low-flow, low-gradient (LFLG) (19%) severe AS was most often observed in those with an AVA<0.8 cm2, while normal-flow, low-gradient (NFLG) (6%) severe AS was least common in this group. On the other hand, among patients with an AVA of 0.8–0.99 cm2, NFLG (63%) severe AS was the predominant flow-gradient subtype, followed by HG (29%) and LFLG (9%) severe AS, respectively (p<0.001).
LV geometry and function
Patients with an AVA of 0.8–0.99 cm2 had indices of LV geometry which were mostly intermediate between AVA<0.8 cm2 and moderate AS, although the LV mass index and LV mass/end-diastolic volume ratio in this group were not statistically significantly different from moderate AS (table 3). Ejection fraction, tissue Doppler-derived parameters of systolic and diastolic functions, and non-invasive estimates of filling pressure were not significantly different between patients with an AVA of 0.8–0.99 cm2 and moderate AS.
LV geometry and function
Outcomes analysis
The combined endpoint was achieved in 64% of all 260 patients with severe AS compared with 20% of patients with moderate AS (p<0.001, figure 3A). When patients with AS with an AVA<1.0 cm2 were further subdivided by AVA, the combined endpoint was achieved in 71%, 52% and 20% of patients with AS with an AVA<0.8 cm2, 0.8–0.99 cm2 and 1.0–1.3 cm2, respectively (p<0.001 for overall p value and for between-group comparisons; figure 3B). Categorisation of all 341 patients by Vp (>4, 3–3.9 and <3 m/s) yielded combined event rates of 73%, 45% and 19% (p<0.001), respectively; categorisation by MG (>40, 25–39.9 and <25 mm Hg) yielded similar results (76%, 48% and 19%, p<0.001). The sensitivity and specificity for the combined endpoint were 61% and 72% for an AVA cut-off of 0.8 cm2 and 91% and 41% for an AVA cut-off of 1.0 cm2, respectively. The sensitivity and specificity were 62% and 78% for MG>40 mm Hg and 62% and 74% for Vp>4.0 m/s, respectively.

Time-to-event curves for the entire AS cohort according to current valvular heart disease guideline1 cut-off of ≤1.0 cm2 for severe AS (A) and by AVA group (B). AS, aortic stenosis; AVA, aortic valve area.
In Cox proportional hazards analysis of patients with AS with an AVA of 0.8–0.99 cm2, symptoms (HR 2.1, 95% CI 1.2 to 3.7, p=0.008), LV mass index (HR 1.017, 95% CI 1.004 to 1.03, p=0.013) and MG>40 mm Hg (HR 2.5, 95% CI 1.5 to 4.4, p=0.001) were significant independent predictors of the combined endpoint at 3 years. In this model, SVi<35 mL/m2 just missed statistical significance. If Vp>4.0 m/s was substituted for MG>40 mm Hg in the multivariable model, SVi<35 mL/m2 (HR 2.9, 95% CI 1.4 to 6.2, p=0.005), LV mass index (HR 1.02, 95% CI 1.006 to 1.03, p=0.004) and Vp>4.0 m/s (HR 2.3, 95% CI 1.4 to 4.1, p=0.002) were significant independent predictors of the combined endpoint at 3 years, while symptoms fell out of the final model. If NFLG status was entered into the model, this parameter was associated with a lower hazard of achieving the combined endpoint (HR=0.4, 95% CI 0.23 to 0.68, p=0.001) at 3 years; LV mass index and symptoms remained predictive in this model (table 4).
Cox proportional hazards model for patients with AS with AVA between 0.8 and 0.99 cm2
Time-to-event curves for patients with AS with an AVA of 0.8–0.99 cm2 divided by flow-gradient subtype are depicted with other AVA groups in figure 4A. Similar outcomes were observed for patients with AS with an AVA of 0.8–0.99 cm2 with HG or LFLG subtype and AVA<0.8 cm2 (69% vs 71%, p=0.83). On the other hand, patients with AVA of 0.8–0.99 cm2 and NFLG subtype had an overall better outcome at 3 years compared with patients with an AVA of 0.8–0.99 cm2 with HG or low flow (41% vs 69%, p<0.001) and patients with an AVA<0.8 cm2 (41% vs 71%, p<0.001), respectively. Patients with an AVA of 0.8–0.99 cm2 and NFLG, however, still had worse outcomes at 3 years compared with patients with moderate AS (41% vs 20%, p=0.008), although divergence of curves was only visualised after approximately 1.5 years. Outcomes of patients with AS with an AVA of 0.8–0.99 cm2 divided by symptom status yielded similar observations (figure 4B). Rates of death and AVR for all AVA groups are shown in online supplementary table 1.
Supplementary file 1

Time-to-event curves for patients with aortic stenosis with an AVA of 0.8–0.99 cm2 divided by flow-gradient subtype (A) and symptom status (B) alongside other AVA groups. Asx, asymptomatic; AVA, aortic valve area; HG, high gradient; LFLG, low flow, low gradient; NFLG, normal flow, low gradient; Sx, symptomatic.
Discussion
In this study, we observed that patients with AS with an AVA between 0.8 and 0.99 cm2 who are classified as severe by current guidelines1 2 exhibit a degree of concentric remodelling and haemodynamic features which are intermediate between moderate AS and those with an AVA<0.8 cm2. The rate of symptoms and indices of transvalvular flow, however, was not statistically different compared with moderate AS. In addition, this group comprised mostly the NFLG, severe AS subtype—patients with an AVA<1.0 cm2 but gradients in the moderate range not due to a low-flow phenomenon. The outcomes of patients with an AVA of 0.8–0.99 cm2 are intermediate between AVA<0.8 cm2 and moderate AS; importantly, the outcomes of this group can be better distinguished by flowgradient and symptom status with the presence of NFLG being protective from death and AVR at 3 years relative to other patients in this group.
Proposed AVA cut-off for severe AS
Some authors have suggested that the AVA cut-off be decreased from 1.0 cm2 to 0.8 cm2 which better corresponds to an MG of 40 mm Hg and Vp of 4.0 m/s.6 A prior study has shown that patients with an AVA of 0.8–0.99 cm2 rarely require AVR in the short term,17 while another has shown that patients with AS who were likely to require AVR had an AVA just below 1.0 cm2.3 This discrepancy may be explained by our analysis which has shown that those with an AVA between 0.8 and 0.99 cm2, in fact, represent a heterogeneous group of patients with severe AS. Therefore, to better understand the outcomes of this group, these patients have to be further examined in the context of flow-gradient subtypes.
NFLG versus LFLG AS
In the setting of severe AS with preserved ejection fraction, discordance between AVA and MG can occur in patients with either a primary low-flow phenomenon (ie, ‘paradoxical low-flow AS’) or in normal-flow conditions.6 This latter observation is likely due to inconsistencies in cut-offs for various parameters for AS severity.6 18 Patients with LFLG, severe AS exhibit a distinct haemodynamic profile, marked concentric remodelling, impaired systolic longitudinal function and poor long-term survival without AVR.7 13 16 19 Patients with NFLG, severe AS, on the other hand, demonstrate less severe concentric remodelling and relatively preserved longitudinal function7 13 similar to patients with moderate AS.7 Normal-flow, low-gradient AS is associated with the best long-term outcomes compared with other severe AS flow-gradient subtypes,13 and these patients exhibit a survival that is similar to moderate AS at 3 years.7
Outcomes analysis
The presence of NFLG among patients with AS with an AVA between 0.8 and 0.99 cm2 was independently associated with a lower hazard of the combined endpoint at 3 years, while elevated transaortic gradients, low flow and symptoms were associated with worse outcomes in this group. In particular, patients with AS with an AVA of 0.8–0.99 cm2 with NFLG had a combined rate of death and AVR which was overall more aligned with patients with moderate AS in the short term but with clear divergence in outcomes after 1.5 years (figure 4A). Assuming a mean AVA in this group of 0.9 cm2 at the beginning of our analysis and a rate of decline in AVA of 0.1 cm2/year,3 patients in this group would expect to transition into more severe AS (ie, AVA<0.8 cm2) by approximately 1.5 years. These observations are consistent with recently published data that suggest that the benefit of AVR over medical therapy in patients with AS with an AVA of 0.8–1.0 cm2 and NFLG appears to occur approximately at 2 years20.Patients with NFLG AS, therefore, likely represent a group in evolution from moderate to severe AS with better prognosis in the short term (<1.5 years) but who may require AVR thereafter.
Implications for clinical practice and guidelines
Our analysis better characterises patients with severe AS with an AVA of 0.8–0.99 cm2 who frequently have discordant parameters of AS severity with important implications for clinical decision making. First, patients with AS with an AVA of 0.8–0.99 cm2 are a heterogeneous group and, therefore, should be assessed on a case-by-case basis. Second, despite the frequent lack of symptoms and the overall favourable prognosis of the NFLG subtype in this group, these patients should, nevertheless, be followed closely as they may increasingly require AVR beyond 1.5 years as they transition to more severe AS. On the other hand, patients with an AVA of 0.8–0.99 cm2 with HG and/or LFLG have a prognosis similar to those with an AVA<0.8 cm2 and, therefore, should be managed as such. Therefore, our observations support currently published guidelines1 2 as well as outcome studies11 20 which indicate that the appropriate cut-off for severe AS is, in fact, ≤1.0 cm2. We have shown that an AVA cut-off of 1.0 cm2 is more sensitive for the combined endpoint than 0.8 cm2, and, therefore, complements the more specific MG and Vp cut-offs. A cut-off of 0.8 cm2, however, might exclude patients with an AVA of 0.8–0.99 cm2 who may have an indication for AVR in the short term (ie, HG and/or LFLG AS) and near long term (ie, NFLG AS).
Limitations
Our study is retrospective and selection bias including unmeasured factors may have influenced patient management. However, indications for AVR according to published guidelines1 2 are based primarily on the presence of symptoms or the development of systolic dysfunction due to severe AS and not merely on haemodynamic parameters. Moreover, parameters of flow and flow-gradient patterns were not known to referring providers and would not have influenced decision for AVR. Lastly, the combined endpoint of death and AVR is consistent with previously published reports which have used this combined outcome to study the natural history of AS.3 4 21
Conclusions
There is significant variability in the frequency of symptoms, LV adaptation to pressure load and prognosis among patients with an AVA<1.0 cm2. In particular, those with an AVA between 0.8 and 0.99 cm2 represent a heterogeneous group of patients with AS with variable outcomes. MG and SVi along with symptoms provide important prognostic value in this group. Our findings support the current cut-off of 1.0 cm2 for severe AS, which is inclusive of all flow-gradient AS subtypes.
Key messages
What is already known on this subject?
Patients with aortic stenosis (AS) with an aortic valve area (AVA) between 0.8 and 0.99 cm2 frequently have low gradients despite being classified as severe. Some have suggested that the AVA cut-off be decreased to 0.8 cm2 which would better correspond to a mean gradient of 40 mm Hg.
What might this study add?
Patients with AS with an AVA between 0.8 and 0.99 cm2 are a heterogeneous group. Those with normal flow and low gradients are frequently asymptomatic and have outcomes similar to moderate AS at approximately 1.5 years but worse outcomes thereafter. Patients with high-gradient or low-flow, low-gradient AS had high event rates similar to those with an AVA<0.8 cm2.
How might this impact on clinical practice?
Decreasing the cut-off to 0.8 cm2 would exclude many patients with AS with an AVA of 0.8–0.99 cm2 who require aortic valve replacement in the short term and near long term. Patients with AS with an AVA of 0.8–0.99 cm2 should be assessed on a case-by-case basis including assessment of flow-gradient pattern.
Acknowledgments
None
References
Footnotes
Contributors PM was involved in design of the study, obtaining IRB approval, data collection and analysis, drafting of the manuscript, revision of the manuscript and submission of the manuscript. KJ was involved with design of the study, obtaining IRB approval, data collection and analysis, and drafting of the manuscript. TCT and AF were involved with data collection and analysis, drafting of the manuscript and revision of the manuscript. JWH was involved with design of the study, data analysis, drafting of the manuscript and revision of the manuscript.
Competing interests None declared.
Ethics approval Ethics approval was obtained from the Massachusetts General Hospital Institutional Review Board prior to initiation of the study.
Provenance and peer review Not commissioned; externally peer reviewed.
Data sharing statement The majority of the data are published in this manuscript. Data can be shared upon request of the corresponding author.