Article Text

Abstract
Objective To describe the place and causes of acute cardiovascular death during the COVID-19 pandemic.
Methods Retrospective cohort of adult (age ≥18 years) acute cardiovascular deaths (n=5 87 225) in England and Wales, from 1 January 2014 to 30 June 2020. The exposure was the COVID-19 pandemic (from onset of the first COVID-19 death in England, 2 March 2020). The main outcome was acute cardiovascular events directly contributing to death.
Results After 2 March 2020, there were 28 969 acute cardiovascular deaths of which 5.1% related to COVID-19, and an excess acute cardiovascular mortality of 2085 (+8%). Deaths in the community accounted for nearly half of all deaths during this period. Death at home had the greatest excess acute cardiovascular deaths (2279, +35%), followed by deaths at care homes and hospices (1095, +32%) and in hospital (50, +0%). The most frequent cause of acute cardiovascular death during this period was stroke (10 318, 35.6%), followed by acute coronary syndrome (ACS) (7 098, 24.5%), heart failure (6 770, 23.4%), pulmonary embolism (2 689, 9.3%) and cardiac arrest (1 328, 4.6%). The greatest cause of excess cardiovascular death in care homes and hospices was stroke (715, +39%), compared with ACS (768, +41%) at home and cardiogenic shock (55, +15%) in hospital.
Conclusions and relevance The COVID-19 pandemic has resulted in an inflation in acute cardiovascular deaths, nearly half of which occurred in the community and most did not relate to COVID-19 infection suggesting there were delays to seeking help or likely the result of undiagnosed COVID-19.
- acute coronary syndromes
- stroke
This article is made freely available for use in accordance with BMJ’s website terms and conditions for the duration of the covid-19 pandemic or until otherwise determined by BMJ. You may use, download and print the article for any lawful, non-commercial purpose (including text and data mining) provided that all copyright notices and trade marks are retained.
https://bmj.com/coronavirus/usageStatistics from Altmetric.com
Introduction
Cardiovascular disease (CVD) is one of the most prevalent underlying condition associated with increased mortality from COVID-19 infection.1–5 Yet, we and others have shown a substantial reduction in presentations to hospitals with acute cardiovascular (CV) conditions including acute coronary syndrome, heart failure, cardiac arrhythmia and stroke during the pandemic.6–11 This would be expected to result in a much higher number of deaths, unless there has been an actual decrease in the incidence of these acute conditions. The detailed impact on mortality from acute CVD has, however, not been studied at national level.
We now report, with high temporal resolution, CV-specific mortality during COVID-19 in England and Wales. In particular, we have evaluated the location of CV deaths (eg, hospitals, home or care homes), their relation to COVID-19 infection and the specific CV fatal events that contributed directly to death. This information is vital for the understanding of healthcare policy during the pandemic and to assist governments around the world reorganise healthcare services.
Methods
Data and deaths
The analytical cohort included all certified and registered deaths in England and Wales ≥18 years of age, between 1 January 2014 and 30 June 2020 recorded in the Civil Registration Deaths Data of the Office for National Statistics (ONS) of England and Wales.12
Acute CV death
The primary analysis was based on any of the 10th revision of the International Statistical Classification of Diseases and Related Health Problems (ICD-10) codes corresponding to the immediate cause of death and contributed causes registered, as stated on the medical certificate of cause of death (MCCD). The MCCD is completed by the doctor who attended the deceased during their last illness within 5 days unless there is to be a coroner’s postmortem or an inquest. CV events directly leading to death (herein called acute CV deaths) were categorised as acute coronary syndrome (ST-elevation myocardial infarction (STEMI), non-STEMI, type 2 myocardial infarction, reinfarction) abbreviated as acute coronary syndrome, heart failure, cardiac arrest, ventricular tachycardia (VT) and/or ventricular fibrillation (VF), stroke (acute ischaemic stroke, acute haemorrhagic stroke, other non-cerebral strokes, unspecified stroke), cardiogenic shock, pulmonary embolism, deep venous thrombosis, aortic disease (aortic aneurysm rupture and aortic dissection) and infective endocarditis (online supplemental table 1). ICD-10 codes ‘U071’ (confirmed) and ‘U072’ (suspected) were used to identify whether a death was related to COVID-19 infection on any part of the MCCD. The place of death as recorded on the MCCD was classified as home, care home and hospice, and hospital.
Supplemental material
Statistical analyses
Baseline characteristics were described using numbers and percentages for categorical data. Data were stratified by COVID-19 status (suspected or confirmed, not infected), age band (<50, 50–59, 60–69, 70–79, 80+ years)), sex and place of death (home, hospital, care home or hospice). The number of daily deaths was presented using a 7-day simple moving average (the mean number of daily deaths for that day and the preceding 6 days) from 1 February 2020 up to and including 30 June 2020, adjusted for seasonality.
The expected daily deaths from 1 February 2020 up to and including 30 June 2020 were estimated using Farrington surveillance algorithm for daily historical data between 2014 and 2020.13 The algorithm used overdispersed Poisson generalised linear models with spline terms to model trends in counts of daily death, accounting for seasonality. The number of non-COVID-19 CV deaths each day from 1 February 2020 were subtracted from the estimated expected daily deaths in the same time period to create a zero historical baseline. Deaths above this baseline maybe interpreted as excess mortality, which were calculated as the difference between the observed daily deaths and the expected daily deaths. Negative values, where the observed deaths fell below the expected deaths, were set to zero. The rate of excess deaths was derived from dividing excess mortality by the sum of the expected deaths between 2 March 2020 and 30 June 2020.
For the categories of acute CV death, the ICD-10 code on the MCCD was counted only once per deceased. Thus, the overall rate of acute CV death represents the number of people with a direct CV cause of death. Given that, people may have more than one of the predefined CV events leading to death, analyses for each of the predefined CV categories represent the number of events (not people) per category. For the purposes of this investigation, CVD that contributed, but did not directly lead to death were excluded from the analyses. All tests were two sided and statistical significance considered as p<0.05. Statistical analyses were performed in R V.4.0.0, and the Farrington surveillance algorithm was fitted using R package ‘surveillance’.
Results
Between 1 January 2014 and 30 June 2020, there were 3 450 381 deaths from all causes among adults. The proportion of deaths increased with increasing age band and there were 1 752 908 (50.8%) in women (table 1). People dying from any of the directly contributing CV categories accounted for 587 225 (17.0%) of all deaths, of which 6.0% had at least two of the predefined CV categories that directly contributed to death. Most deaths occurred in hospital (63.0%) followed by home (23.5%) and at care home (13.5%).
Acute CV deaths before and after 2 March 2020, by COVID-19 status
Acute CV deaths after 2 March 2020
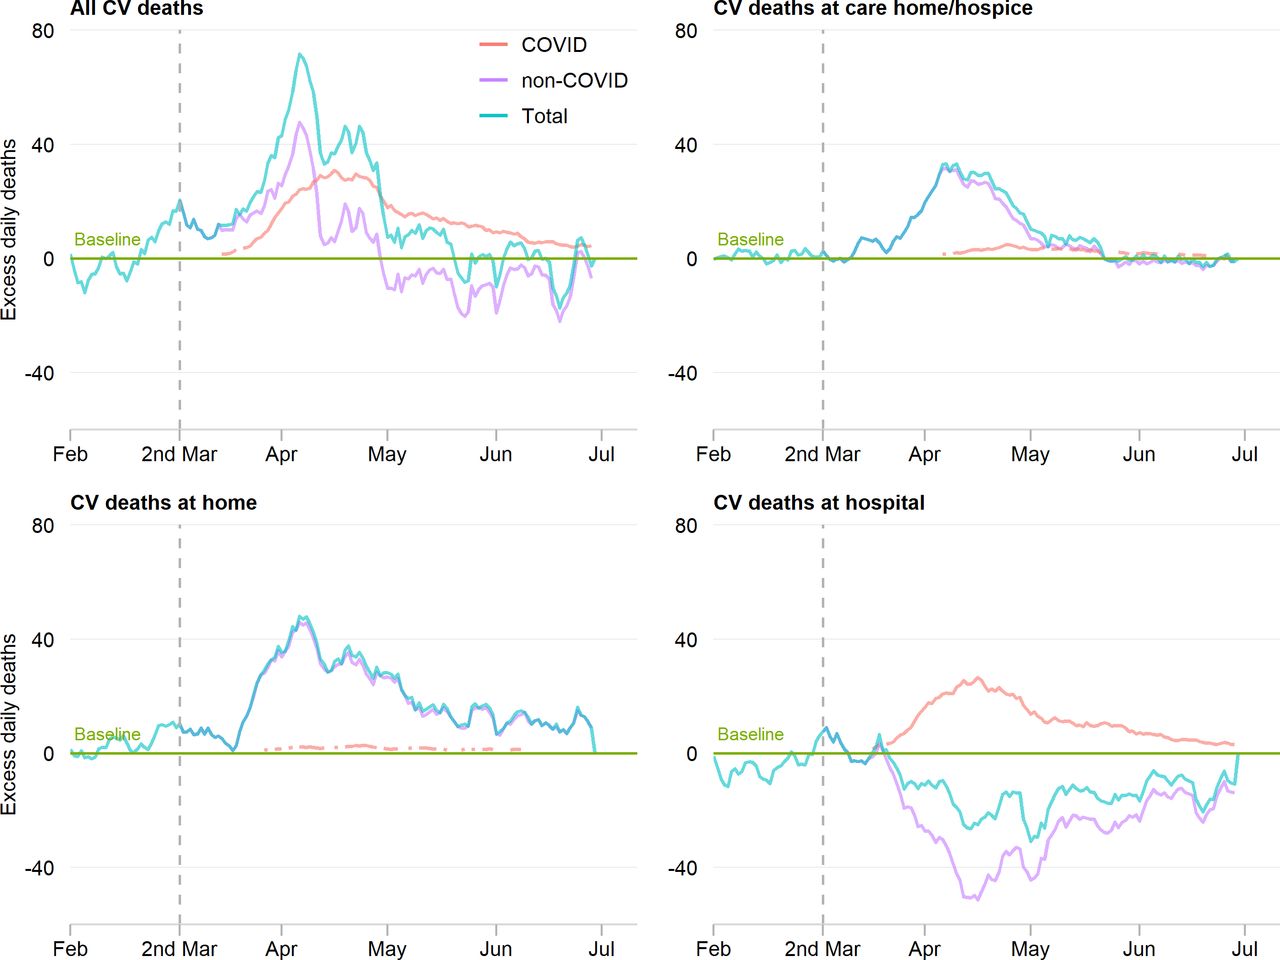
Following the first UK death from COVID-19 on 2 March 2020, there were 28 969 acute CV deaths of which 5.1% related to COVID-19 (7.9% suspected; 92.1% confirmed), and an excess acute CV mortality of 2085 (a proportional increase of 8%) compared with the expected historical average in the same time period of the year. COVID-19 deaths accounted for 1307 (71.0%) of all excess deaths after this date (figure 1, table 2). Qualitatively, excess acute CV mortality began in late March 2020 and peaked in early April 2020. While hospital remained the most frequent place of acute CV death, there were proportionally fewer deaths in hospital (53.4% vs 63.0%) and more at home (30.9% vs 23.5%) and in care homes (15.7% vs 13.5%) (table 1). Moreover, deaths at home saw the greatest increase in excess acute CV deaths (a proportional increase of 35%), followed by deaths at care homes (a proportional increase of 32%) and there was no excess acute CV deaths in hospital (table 2). The number of excess acute CV deaths were higher more among men than women (1182 vs 948; a proportional increase of 8% vs 7%) and were highest in the age category 18–49 years (176, a proportional increase of 17%) (table 2). The most frequent cause of acute CV death during the COVID-19 pandemic was stroke (35.6%), followed by acute coronary syndrome (24.5%), heart failure (23.4%), pulmonary embolism (9.3%) and cardiac arrest (4.6%) (table 1). Moreover, deep vein thrombosis demonstrated the greatest increase in excess acute CV death (20, a proportional increase of 23%), followed by pulmonary embolism (437, a proportional increase of 19%) and cardiogenic shock (54, a proportional increase of 14%) (figure 2, table 2).

Time series of acute cardiovascular (CV) deaths, by place of death. The number of daily CV deaths is presented using a 7-day simple moving average (indicating the mean number of daily CV deaths for that day and the preceding 6 days) from 1 February 2020 up to and including 30 June 2020, adjusted for seasonality. The number of non-COVID-19 excess CV deaths each day from 1 February 2020 were subtracted from the expected daily death estimated using Farrington surveillance algorithm in the same time period. The green line is a zero historical baseline. The red line represents daily COVID-19 CV death from 2 March to 30 June 2020; the purple line represents excess daily non-COVID-19 CV death from 2 March to 30 June 2020 and the blue line represents the total excess daily CV death from 1 February to 30 June 2020.

Time series of acute cardiovascular (CV) deaths by COVID-19, by cause of death. The number of daily CV deaths is presented using a 7-day simple moving average (indicating the mean number of daily CV deaths for that day and the preceding 6 days) from 1 February 2020 up to and including 30 June 2020, adjusted for seasonality. The number of non-COVID-19 excess CV deaths each day from 1 February 2020 were subtracted from the expected daily death estimated using Farrington surveillance algorithm in the same time period. The green line is a zero historical baseline. The red line represents daily COVID-19 CV death from 2 March to 30 June 2020; the purple line represents excess daily non-COVID-19 CV death from 2 March to 30 June 2020 and the blue line represents the total excess daily CV death from 1 February to 30 June 2020. VF, ventricular fibrillation; VT, ventricular tachycardia.
COVID-19 related and total excess acute CV deaths
COVID-19-related acute CV deaths
Compared with deaths prior to 2 March 2020, COVID-19 related acute CV deaths were more likely to occur in hospital (81.1% vs 63.0%), much less at home (7.1% vs 23.5%) and remained of similar proportions to non-COVID-19-related acute CV deaths in care homes (13.5% vs 11.8%). The rate of COVID-19-related excess CV deaths was higher in hospitals than care homes (a proportional increase of 7% vs +5%) and less at home (a proportional increase of 2%). Excess COVID-19-related acute CV deaths occurred in similar proportions for men and women (a proportional increase of 6% vs 5%), and the rate of excess COVID-19-related acute CV deaths was comparable across the age bands (table 2). The greatest proportional increase of excess COVID-19-related acute CV death was due to pulmonary embolism (251, a proportional increase of 11%) followed by stroke (562, a proportional increase of 6%), acute coronary syndrome (318, a proportional increase of 5%), cardiac arrest (93, a proportional increase of 6%) and heart failure (273, a proportional increase of 4%) (figure 2, table 2).
Place and cause of death after 2 March 2020
The most frequent causes of excess acute CV death in care homes and hospices were stroke (715, a proportional increase of 39%) and heart failure (227, a proportional increase of 25%), which compared with acute coronary syndrome (768, a proportional increase of 41%) and heart failure (734, a proportional increase of 33%) at home, and pulmonary embolism (155, a proportional increase of 13%) and cardiogenic shock (55, a proportional increase of 15%) in hospital (figure 3, table 3). For stroke, acute coronary syndrome, heart failure and cardiac arrest, the numbers of deaths in hospital were lower than the historical baseline (figure 3).

Time series of acute cardiovascular (CV) deaths by cause of death and place of death. The number of daily CV deaths is presented using a 7-day simple moving average (indicating the mean number of daily CV deaths for that day and the preceding 6 days) from 1 February 2020 up to and including 30 June 2020, adjusted for seasonality. The number of non-COVID-19 excess CV deaths each day from 1 February 2020 were subtracted from the expected daily death estimated using Farrington surveillance algorithm in the same time period. The green line is a zero historical baseline. The red line represents excess daily death at hospital; the purple line represents excess daily CV death at care home and hospice and the blue line represents excess daily CV death at home. VF, ventricular fibrillation; VT, ventricular tachycardia.
Excess acute CV deaths by cause and place of death
Discussion
We show for the first time, in a nationwide complete analysis of all adult deaths, the extent, site and underlying causes of the increased acute CV mortality during the COVID-19 pandemic compared with previous years. This shows that the pandemic has resulted in an abrupt inflation in acute CV deaths above that expected for the time of year. Nearly half of the deaths occurred outside of the hospital setting, either at home or in care homes, with people’s homes witnessing the greatest proportional increase in excess acute CV deaths. The most frequent cause of acute CV death during the COVID-19 pandemic in England and Wales was stroke followed by acute coronary syndrome and heart failure. This is key information to optimise messaging to the public, as well as for allocation of health resources and planning.
Numerous international studies have reported the decline in hospital presentations for a range of CV emergencies.6–11 To the best of our knowledge, this is the first study to show that this is associated with an adverse overall CV impact. While stroke and acute coronary syndrome accounted for the vast majority of acute CV deaths, the number of deaths in hospital due to these conditions fell below that expected for the time of year and it increased in the community, and particularly in people’s homes. This ‘displacement of death’, most likely, signifies that the public either did not seek help or were not referred to hospital during the pandemic—a finding supported by the fact that the majority of acute CV deaths were not recorded as related to infection with COVID-19. Given the times series plots show that the excess in acute CV mortality began in late March 2020 and peaked in early April 2020, government directives at the time including the onset of the UK lockdown on 23 March 2020 could have accentuated a maladaptive public response.
The major causes of acute CV death were different between hospital and community settings. This ‘differential of cause of death by place’ provides an understanding of how the infection and public response to the pandemic played out. The most frequent cause of excess acute CV death in people’s homes was acute coronary syndrome, in care homes and hospices it was stroke and in hospital it was pulmonary embolism. Assuming that the public did not seek help for medical emergencies for fear of contagion in hospital or to prevent hospitals being overwhelmed, then it is not surprising that there were deaths from acute coronary syndrome at home. Complications of untreated acute myocardial infarction include cardiac arrest, arrhythmia and acute heart failure. We found that in people’s homes there were increases in excess acute CV deaths from cardiac arrest (in line with others’ findings14) and heart failure, and in hospitals there were increases in excess deaths from cardiogenic shock and VT and VF—all of which are complications of late presentation myocardial infarction. In hospital, we also found an inflation of deaths from infective endocarditis and aortic dissection and rupture, indicating perhaps a more advanced (and for some, irreversible) stage of disease presentation during the pandemic, akin to the situation with acute myocardial infarction.
Care homes and hospices witnessed a substantial increase in excess acute CV deaths. Herein, stroke, heart failure, acute coronary syndrome and pulmonary embolism were the the most common causes of acute CV death. This finding highlights the susceptibility of the elderly and comorbid to the wider implications of COVID-19 crisis. That is, not only were care home residents prone to the respiratory effects of COVID-19 infection but they will also have been exposed to the acute CV complications of COVID-19 and decisions not to go to hospital for fear of becoming infected. This situation will have been exacerbated by several factors, including the discharge of unknowingly infected patients from hospitals to care homes early in the course of the pandemic (where the virus could easily spread15 and actions to reduce the spread of the virus in social care were too late and insufficient16), a lack of systematic antibody testing for the SARS-CoV-2 virus, the efficient person-to-person transmission of the virus, and its propensity to death in the vulnerable.1 17
While previous reports have described an elevated risk of death among the elderly and people with CV disease during the COVID-19 pandemic, none have characterised the CV events directly leading to death and few quantified the excess in acute CV mortality.1 3 18 To date, insights have been derived from small series of cases, regional or national death records data—each reporting elevated mortality rates, but none by the type and place of CV death together.1 2 18–22 The unique strengths of this investigation include full population coverage of all adult deaths across places of death. Most previous reports have been confined to hospitals deaths and have not captured the full extent of the impact of the pandemic, including deaths outside of hospitals in people who may not have been tested for the disease.
Nonetheless, our study has limitations. During the COVID-19 pandemic, emergency guidance enabled any doctor in the UK (not just the attending) to complete the MCCD, the duration of time over which the deceased was not seen before referral to the coroner was extended from 14 to 28 days, and causes of death could be ‘to the best of their knowledge and belief’ without diagnostic proof, if appropriate and to avoid delay.23 This may have resulted in misclassification bias, with under-reporting of the deaths directly due to CV disease in preference to COVID-19 infection (which is a notifiable disease under the Health Protection (Notification) Regulations 2010) or respiratory disease. In fact, we found that MCCDs with COVID-19 certification less frequently contained details of acute CV events directly leading to death. Although the MCCD allows the detailing of the sequence of events directly leading to death, we found that after 2 March 2020 few (5.7%) had multiple acute CV events recorded, and therefore the categorisation of the acute CV events effectively represents per-patient events. The lower proportion of deaths with COVID-19 at home and in care homes may represent the lack of access to community-based COVID-19 testing. Equally, because there was no systematic testing of the UK populace for the presence the COVID-19, deaths associated with the infection may have been underestimated.24 This analysis will have excluded a small proportion of deaths under review by the coroner, though typically these will have been unnatural in aetiology. In addition, we did not include the spatial information in the Farrington surveillance algorithm, which may affect the accuracy of the estimates for the expected death.
Conclusion
To date, there is no whole-population, high temporal resolution information about acute CV-specific mortality during the COVID-19 pandemic. Through the systematic classification of all adult deaths in England and Wales, it has been possible to show that there has been an excess in acute CV mortality during the COVID-19 pandemic, seen greatest in the community and which corresponds with the onset of public messaging and the substantial decline in admissions to hospital with acute CV emergencies.
Key messages
What is already known on this subject?
Cardiovascular disease is one of the most prevalent underlying conditions associated with increased mortality from COVID-19 infection, along with dementia and Alzheimer’s disease.
At the same time, there has been a substantial reduction in presentations to hospitals with acute cardiovascular (CV) conditions.
What might this study add?
Our study of all adult deaths in England and Wales between 1 January 2014 and 30 June 2020 has quantified the CV mortality impact of the COVID-19 pandemic, be this related to contagion and/or the public response.
It shows that during the pandemic there has been an inflation in acute CV deaths above that expected for the time of year.
Home death had the greatest increase in excess acute CV death, and the most frequent cause of acute CV death during this period was stroke, followed by acute coronary syndrome.
How might this impact on clinical practice?
These contemporary nationwide cause and place of mortality data provide key information to optimise messaging to the public, as well as for allocation of health resources and planning.
Acknowledgments
We acknowledge the intellectual input of Professor Colin Baigent, University of Oxford. JW had full access to all the data in the study and takes responsibility for the accuracy of the data analysis. The ONS provided NHS Digital with the mortality data and takes responsibility for the integrity of these data. The programme was endorsed the British Heart Foundation collaborative, which also includes Health Data Research UK, HSC Public Health Agency, National Institute for Cardiovascular outcomes Research, Cancer Research UK, Public Health Scotland, NHS Digital, SAIL Databank and UK Health Data Research Alliance.
References
Footnotes
Twitter @MMamas1973, @DrShingKwok, @cpgale3
Contributors CPG and JW was responsible for the study design and concept. JW performed the data cleaning and analysis. JW and CPG wrote the first draft of the manuscript, and all authors contributed to the writing of the paper.
Funding JW and CPG are funded by the University of Leeds. MAM is funded by the University of Keele.
Competing interests None declared.
Patient and public involvement Patients and/or the public were not involved in the design, or conduct, or reporting, or dissemination plans of this research.
Patient consent for publication Not required.
Ethics approval Ethical approval was not required as this study used fully anonymised routinely collected civil registration deaths data. The data analysis was conducted through remote access to NHS Digital Data Science Server.
Provenance and peer review Not commissioned; externally peer reviewed.
Data availability statement Data may be obtained from a third party upon ethical approval and are not publicly available. All data relevant to the study are included in the article or uploaded as supplementary information. The Secretary of State for Health and Social Care has issued a time limited Notice under Regulation 3(4) of the NHS (Control of Patient Information Regulations) 2002 to share confidential patient information.