Article Text

Abstract
Background Models to stratify risk for patients hospitalised for acute decompensated heart failure (ADHF) do not include the change in N-terminal pro-B-type natriuretic peptide (NT-proBNP) levels during hospitalisation.
Objective The aim of our study was to develop a simple yet robust discharge prognostication score including NT-proBNP for this notorious high-risk population.
Design Individual patient data meta-analyses of prospective cohort studies.
Setting Seven prospective cohorts with in total 1301 patients.
Patients Our study population was assembled from the seven studies by selecting those patients admitted because of clinically validated ADHF, discharged alive, and NT-proBNP measurements available at admission and at discharge.
Main outcome measures The endpoints studied were all-cause mortality and a composite of all-cause mortality and/or first readmission for cardiovascular reason within 180 days after discharge.
Results The model that incorporated NT-proBNP levels at discharge as well as the changes in NT-proBNP during hospitalisation in addition to age ≥75 years, peripheral oedema, systolic blood pressure ≤115 mm Hg, hyponatremia at admission, serum urea of ≥15 mmol/L and New York Heart Association (NYHA) class at discharge, yielded the best C-statistic (area under the curve, 0.78, 95% CI 0.74 to 0.82). The addition of NT-proBNP to a reference model significantly improved prediction of mortality as shown by the net reclassification improvement (62%, p<0.001). A simplified model was obtained from the final Cox regression model by assigning weights to individual risk markers proportional to their relative risks. The risk score we designed identified four clinically significant subgroups. The pattern of increasing event rates with increasing score was confirmed in the validation group (BOT-AcuteHF, n=325, p<0.001).
Conclusions In patients hospitalised for ADHF, the addition of the discharge NT-proBNP values as well as the change in NT-proBNP to known risk markers, generates a relatively simple yet robust discharge risk score that importantly improves the prediction of adverse events.
- Heart Failure
Statistics from Altmetric.com
Background
Heart failure (HF) is a major and growing public health problem in developed countries with a prevalence of about 0.4–2.2%.1 ,2 Particularly patients admitted for acute decompensated HF (ADHF) have high morbidity and mortality rates, most conspicuously in the first months after discharge. Worrisome readmission rates approaching 30–60% within 6 months have been reported.3 Accurate predictions of events after HF admission would be important to design targeted strategies at those with the highest risk of adverse events. Plasma levels of N-terminal pro-B-type natriuretic peptide (NT-proBNP) or B-type natriuretic peptide (BNP) are established indicators of the diagnosis of HF4 ,5 and also allow predicting HF morbidity and mortality.6 More specifically, previous smaller studies in patients admitted for ADHF showed that discharge NT- proBNP levels predicted further events; lower levels of NT-proBNP at discharge are related to better outcome on a population level.4 ,7–11
Prognostication of patients is useful in allowing clinicians to triage patients during and after hospitalisation,12 ,13 and can also be used to select patients at high risk in whom the use of potent new therapies could be tested. Established models for risk stratification of patients admitted for ADHF do not employ the change in NT-proBNP during hospitalisation, because no studies of sufficient size have been available where NT-proBNP has been measured at admission and at discharge.14–18 Hence, we pooled individual patient data from several studies to develop, test and asses the clinical benefits of a discharge risk stratification model for evaluation of patients hospitalised for ADHF.19–21 Our aim was to develop a new, simple discharge risk score, using NT-proBNP values during hospitalisation and at discharge, to provide a tool that potentially could be applied in clinical settings.
Methods
Source populations
We searched for prospective studies of patients hospitalised for ADHF with NT-proBNP measurements at admission and at discharge (Medline/Embase, PubMed, and Cochrane). We found 357 abstracts in total. After removing all duplicate abstracts found in the different databases (29 abstracts) and narrative reviews, letters, editorials, comments and the like (109 abstracts), we ultimately reviewed 219 abstracts. A more explicit detail on the search and data collection has been added as an online supplementary appendix (eAppendix 1).
We identified five prospective cohort studies eligible for inclusion.7–9 ,22 ,23 Additionally, on the basis of our personal contact, we knew of two Dutch cohorts of patients hospitalised for ADHF. The first cohort was part of a registry at the Academic Medical Center (AMC) in Amsterdam. The second cohort consisted of patients screened for the PRIMA study.24 Furthermore, we identified one more published study at the time we were collecting our data on the basis of the bibliographies of expert advisors.11 All cohorts were registries, and patients were admitted for ADHF, in whom NT-proBNP concentrations had been measured at admission and at discharge. All studies were approved by the ethical commission in their respective centres. For the conduction of the current study, we received the approval of the ethical commission. The principal investigators of seven of the eight studies7–9 ,11 ,23 ,24 agreed to perform a collaborative analysis. The flow diagram for selection of articles is shown in figure 1.

Flow diagram for selection of articles. aHalf the cohort was excluded, because of duplicated data. bWe excluded 40% of the original cohort, because of missing follow-up data.
Study population
Our study population was assembled from the seven cohorts by selecting those patients that satisfied the following inclusion criteria: (1) admitted because of clinically validated ADHF,25 (2) discharged alive and (3) NT-proBNP measurements available at admission and at discharge. We excluded 51 patients of the Verdiani et al11 cohort from our analysis, because no follow-up was available. We also removed duplicate reports of the same patients (n=147) in the Bettencourt et al8 and Pimenta et al23 cohorts from the analyses. Eventually, our cohort consisted of 1301 patients. Because of the above exclusions, the numbers of patients reported here may differ from those in the original publications.
Statistical analysis
The primary endpoint of this study was time till death from any cause within 180 days. The secondary endpoint was time till death from any cause, or time till the first readmission for cardiovascular reason within 180 days. The relations of NT-proBNP to death from all causes, and to the composite endpoint, were investigated with the use of Kaplan–Meier curves (KM-curves), compared with Log Rank test, and the use of Cox proportional hazards regression in univariable and multivariable analyses. In these models, we evaluated the effect of absolute NT-proBNP levels at discharge according to cut-off levels based on quartiles among those who died (<1500 pg/mL, 1500–5000 pg/mL, 5001–15 000 pg/mL, and >15 000 pg/mL). The effect of NT-proBNP reduction percentage was evaluated using dichotomised (≤30%) which was derived as the median percentage reduction in NT-proBNP among those who died and which was also confirmed in a ROC-analysis (area under the curve (AUC) 0.68, 95%CI 0.64 to 0.72) of NT-proBNP reductions on mortality (data not shown). It should be noted that for the calculation of the risk estimate and for the calculation of the Kaplan–Meier curves, we did use the whole population. For cTnT, a prospectively defined upper reference limit of 0.05 μg/L and a lower limit of 0.03 μg/L were used for statistical analysis. The cut-off levels for anaemia (haemoglobin <129 g/L (8 mmol/L) in men; <121 g/L (7.5 mmol/L) in women), hyponatremia (sodium <135 mmol/L), and estimated Glomerular Filtration Rate (eGFR) (≤30 mL/min/1.73 m²) are based on European Society of Cardiology (ESC) guidelines,26 and the cut-off levels for systolic blood pressure (SBP ≤115 mm/Hg) and serum urea (≥15 mmol/L) levels are based on previously published risk stratification analyses in patients hospitalised for ADHF.15 ,16
A total of 24 admission and discharge characteristics arranged in a dichotomous fashion were screened as candidate predictor variables of 180-day mortality. These variables were included based on previous research and based on their clinical relevance.1 ,4–11 13–18 ,22 ,23 ,26–32 Each factor was tested independently in a univariable Cox regression model, and all variables considered were added in a multivariable model to assess the statistical significance and reliability of NT-proBNP levels. Thereafter, a multivariable stepwise (backward elimination) Cox regression model was used to build the final model. Variables associated with p value less then 0.05 by the Wald statistic were retained in the model. To check for the proportional hazards assumption we used the log-minus-log function, and in the presence of non-proportionality, we considered the HRs as the average HR for a predictor over the follow-up period. Furthermore, separate baseline hazard functions were used for the different cohorts to adjust for between-study differences. To confirm our final model, a bootstrapping method was performed. Data were resampled 1.000 times, fitting a Cox regression model with backward selection technique in a stepwise manner. The predictive performance of the model to classify patients was evaluated using the C statistic (area under the receiver operating characteristic curve). To estimate the additional discriminative value of NT-proBNP cut-off levels, we calculated the C-statistic for the models with and without the addition of NT-proBNP levels. To further quantify this discriminative power, we used the method previously described by Pencina et al.33 We analysed differences in patients’ individual estimated probability after addition of NT-proBNP cut-off levels as categorical variable to a referent model containing the previously identified baseline clinical characteristics. For the net reclassification improvement (NRI), each probability increase would imply improved prediction ability, whereas the opposite would imply worse prediction ability. We also calculated the integrated discrimination improvement (IDI), which directly compares the mean difference in probability between models with and without the addition of NT-proBNP cut-off levels.
Moreover, we investigated the additional predictive value of the decrease in NT-proBNP during hospitalisation on top of the ESCAPE (Evaluation Study of Congestive Heart Failure and Pulmonary Artery Catheterisation Effectiveness) Risk Model and Discharge Score in a bivariable Cox regression model. A more explicit detail on this analysis and the results has been added as an online supplementary appendix (eAppendix 2).
The multivariable Cox regression model was used to develop a predictive discharge score based on the strongest predicting variables regarding mortality and including NT-proBNP absolute values at discharge and percentage reduction. A simplified model was obtained by assigning weights to individual risk markers proportional to their regression coefficients. Cut-offs of the ÉLAN-HF Score (European coLlaboration on Acute decompeNsated Heart Failure) for the different risk groups were based on quartiles among those who had an event. However, it should be noted that for the calculation of the risk estimate and the calculation of the Kaplan–Meier curves, we did use the whole population.
The risk score was externally validated in a separate cohort of patients from the BOT-AcuteHF (NT-proBNP in the Optimisation of Treatment after recent Acute Heart Failure) trial (n=325, ClinicalTrials.gov Identifier: NCT00498472). The BOT-AcuteHF trial was designed to evaluate whether the assessment of NT-proBNP levels measured before discharge improves prognostication. This study enrolled patients between January 2006 and April 2010 who were admitted for ADHF with New York Heart Association (NYHA) Class III or IV and requiring intravenous therapy. Patients were randomly assigned to NT-proBNP guided treatment or standard care. The trial was recently completed but the results are yet to be published. In this study, NT-proBNP levels were measured at 3 days before discharge and at discharge. Hence, the change between values at discharge and those at 3 days before discharge was used as a proxy for the change parameter in our risk model. We calculated the KM curves for 1-year mortality for the four categories of our risk score.
Demographic characteristics are presented as frequencies and percentages when it concerns categorical data, and the Fisher exact test was used to make a comparison. Normally distributed, continuous variables are reported as mean±SD, and were compared using the Student t test. Other continuous data, expressed as median with IQR, were compared using the Mann–Whitney U test. Multiple imputation pooling algorithms was used to correct for missing values. All probability values were two-sided and considered significant if <0.05. Statistical analyses were conducted using SPSS V.19.0.1 (SPSS, Chicago, Illinois, USA) and R (R Foundation for Statistical Computing, Vienna, Austria).
Results
Table 1 shows the baseline characteristics of the 1301 patients included in our study. The median age of the study population was 74 years, with 607 (47%) patients aged 75 years or older. Of the 1301 patients admitted for ADHF, 631 (49%) patients were known to have an ischaemic aetiology, 838 (72%) of the patients had an LVEF <45%, and 513 (43%) patients were diagnosed to have AF at admission. The median NT-proBNP value at admission was 6447 pg/mL and the median discharge NT-proBNP value was 3252 pg/mL. At discharge, 1156 (95%) patients received diuretics, 806 (66%) of the patients received an ACE-inhibitor, and 685 (57%) patients received a β blocker.
Baseline characteristics study population
Of the study patients, 195 (84 women and 111 men) reached the primary endpoint of the study (all-cause mortality), which was equal to a mortality of 15% at 180 days. Furthermore, 558 study patients (228 women and 330 men) reached the composite (all-cause mortality/cardiovascular readmissions) endpoint, which equals an event rate of 43%. Mortality and composite event rates, according to quartiles of absolute NT-proBNP values at discharge, are shown in figure 2A. The 180-day cumulative mortality was 4.1% among patients with an absolute NT-proBNP discharge level of <1500 pg/mL. This 180-day mortality more than doubled to 10% when the NT-proBNP discharge level was between 1500 and 5000 pg/mL, and again doubled to 24% when the NT-proBNP discharge level was between 5001 and 15 000 pg/mL. Patients with a NT-proBNP discharge level of >15 000 pg/mL had a mortality of 41%. The same pattern was also observed for the composite endpoint with the cumulative event rates of 28%, 43%, 53% and 63% for the four NT-proBNP absolute discharge levels, respectively.
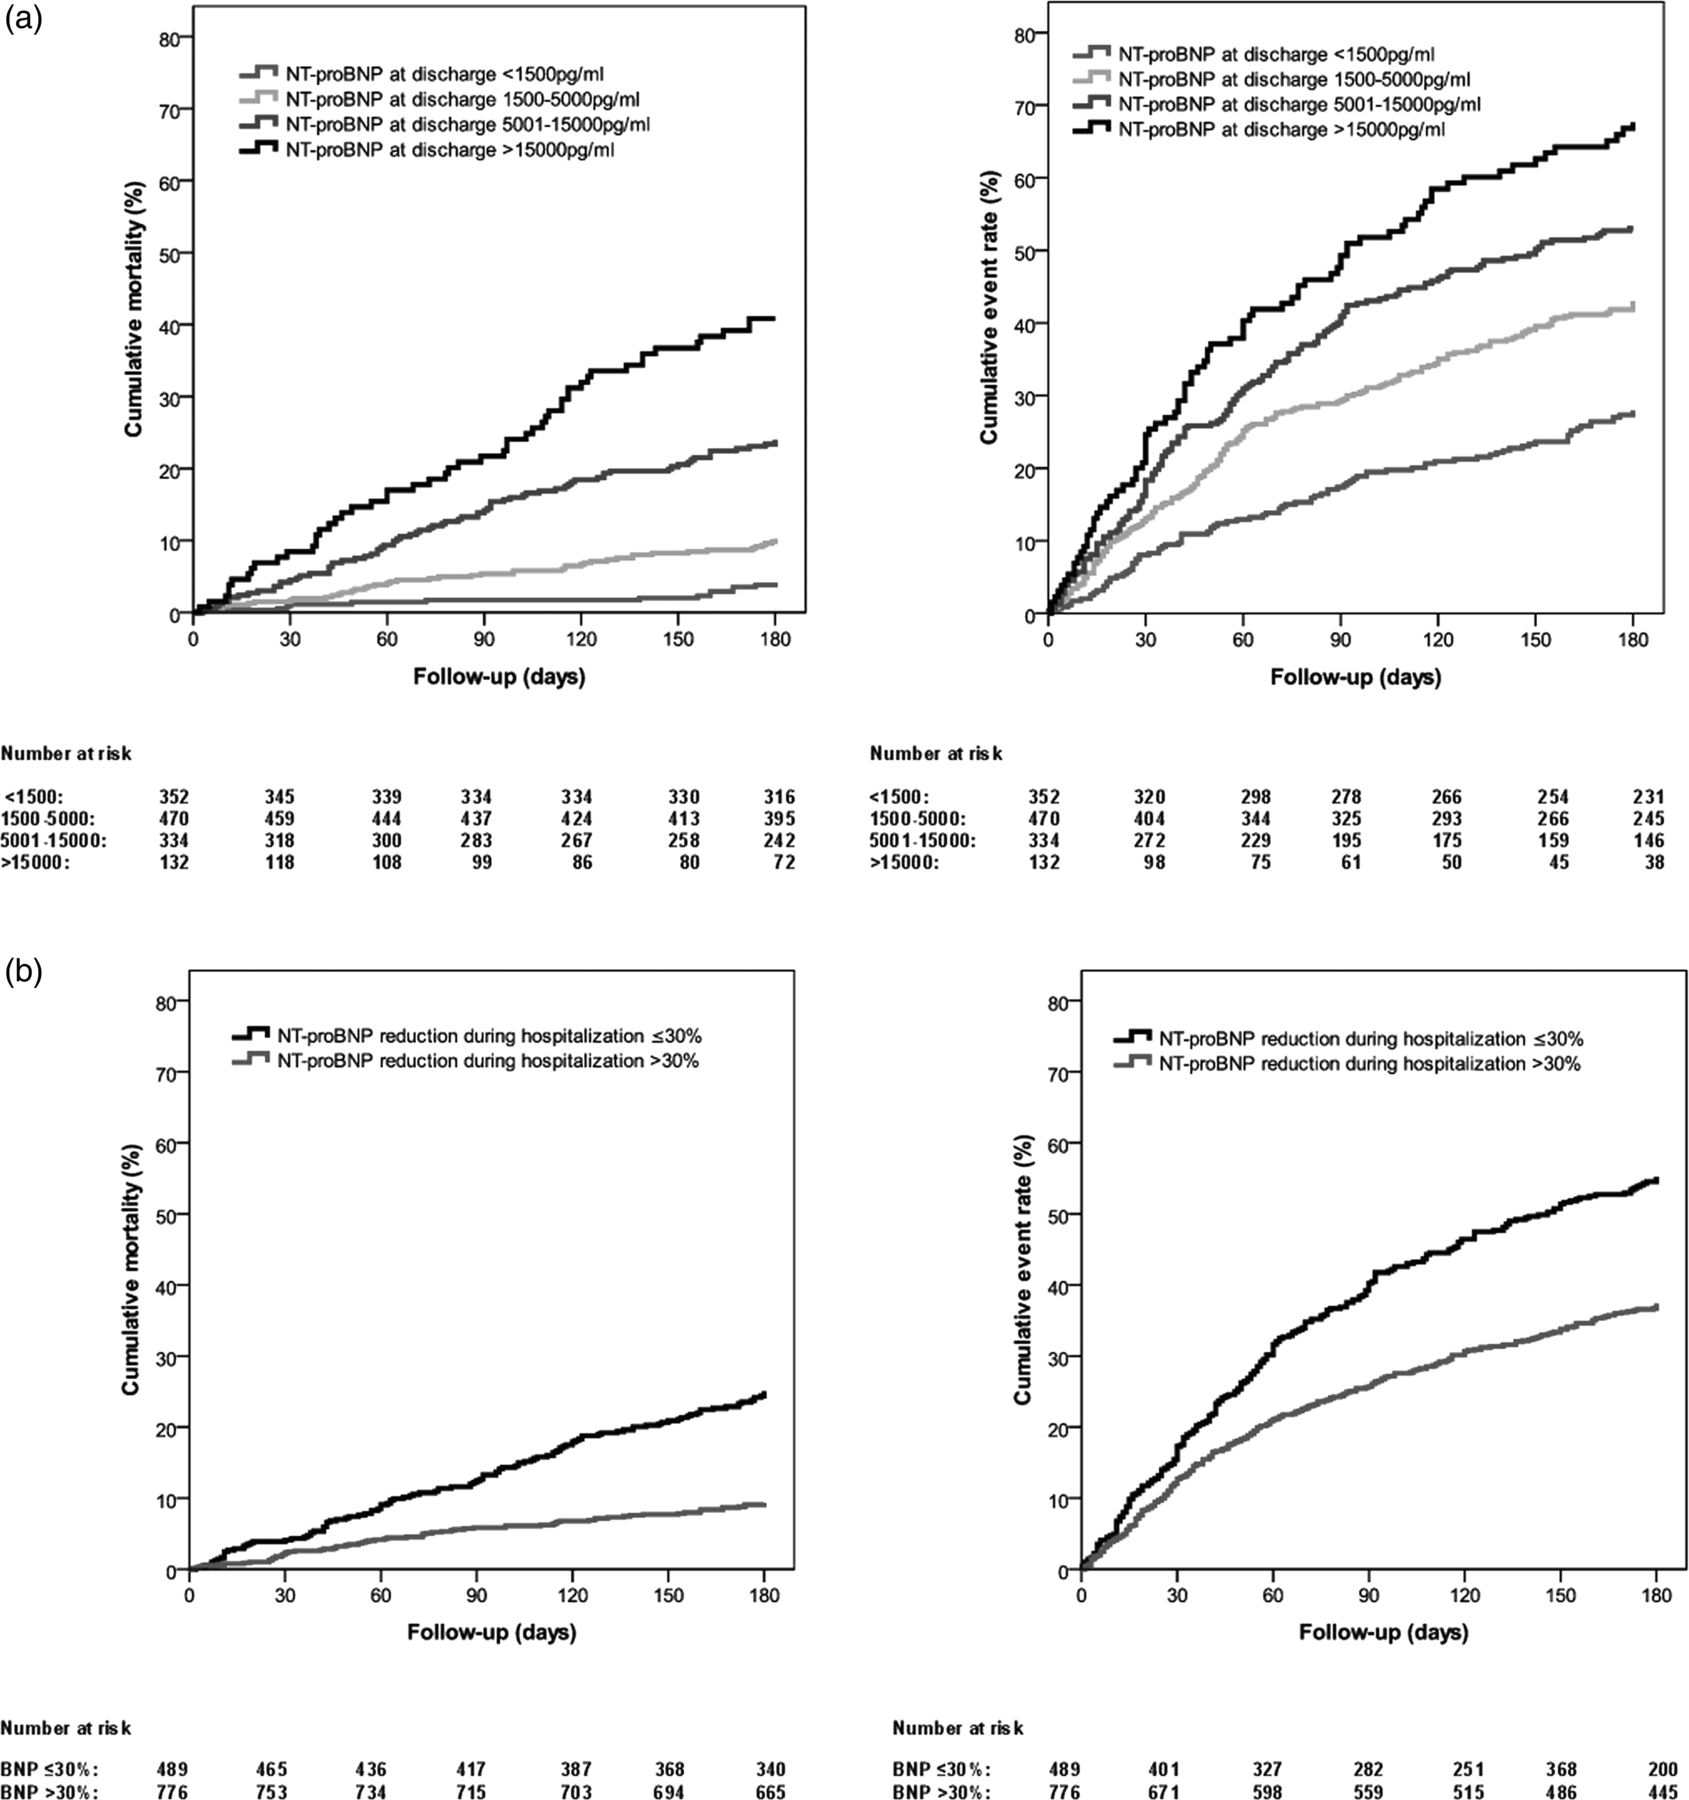
Kaplan–Meier curves for all-cause mortality and composite endpoint at 180 days according to the quartiles of the absolute NT-proBNP values at discharge (A) and according to the dichotomised NT-proBNP percentage reduction during hospitalisation (B). NT-proBNP indicates N-terminal pro-B-type natriuretic peptide. Access the article online to view this figure in colour.
The relation between dichotomised 30% NT-proBNP reduction percentage and the outcome is shown in figure 2B. The 180-day cumulative mortality was twice as high among patients with a NT-proBNP reduction of ≤30% in comparison to the patients with a NT-proBNP reduction of >30%. This also applied to the composite event rate.
Univariable and multivariable Cox regression analyses are presented in table 2. In the multivariable analyses (table 2, right panel), NT-proBNP absolute values at discharge and NT-proBNP percentage reduction were predictors of death within 180 days, albeit with slightly attenuated HRs for the NT-proBNP absolute levels at discharge, as well as for the NT-proBNP reduction percentage during hospitalisation. Other independent risk markers were, age ≥75 years at admission, presence of peripheral oedema at admission, SBP ≤115 mm Hg at admission, hyponatremia at admission, serum urea of ≥15 mmol/L at discharge and NYHA class at discharge. According to our multivariable regression analysis, LVEF ≤25%, cTNT values at admission and eGFR ≤30 mL/min/1.73 m² at discharge were not independently associated with 180-day mortality. Table 3 shows the association of NT-proBNP levels to LVEF, eGFR and cTnT levels.
Univariable and multivariable Cox regression analysis for 180-day mortality
Association of NT-proBNP levels to LVEF, eGFR and cTnT
The C-statistics increased significantly (AUC 0.78, 95% CI 0.74 to 0.82 vs AUC 0.71; 95% CI 0.67 to 0.76, p<0.001) for the prediction of death from any cause within 180 days when NT-proBNP levels were added into a model with established risk markers. This also accounts for the model that uses the covariates with their raw uncategorised value (AUC 0.77. 95% CI 0.73 to 0.82). Furthermore, the addition of NT-proBNP levels contributed significantly (p<0.001) with a 62% NRI to the reference model containing clinical predictors; the NRI for events was 33% and the NRI for non-events was 29%. The IDI was 0.07; p<0.001, which consisted of IDI for events (0.06) and IDI for non-events (0.01).
Construction of ÉLAN-HF score
After assigning weights to individual risk markers proportional to their regression coefficients, the ÉLAN-HF Score could be calculated (table 4). The mortality increased significantly in a stepwise manner across the risk groups (table 5) of low (≤2 point), intermediate (3–4 points), high (5–7 points), and very high (≥8 points), which was also visualised in a Kaplan–Meier curve (figure 3A). The mortality for the intermediate risk group almost doubled to 9%, compared with the low-risk group (3.6%). This cumulative 180-day mortality doubled again to 23% for the high-risk group, and this compared with the very high-risk group more that doubled again to 51%. The composite event rate increased also in the same stepwise manner for the four risk groups as shown in figure 3B; low (28%), intermediate (39%), high (59%), and very high (70%). The C statistic for the simplified model was 0.76 (95% CI 0.71 to 0.80).
Calculation of ÉLAN-HF (European coLlaboration on Acute decompeNsated Heart Failure) score
Mortality rates for the ÉLAN-HF (European coLlaboration on Acute decompeNsated Heart Failure) score

Kaplan–Meier curves for All-cause mortality (A) and the composite endpoint (B) at 180 days and for all-cause mortality in the BOT-acuteHF at 1 Year (C) according to ÉLAN-HF Score. Event rates increased significantly as the risk score increased in both cohorts. ÉLAN-HF, European coLlaboration on Acute decompeNsated Heart Failure. Access the article online to view this figure in colour.
External validation of ÉLAN-HF score
The external validation of ÉLAN-HF Score in the BOT-AcuteHF population (n=325) is shown in figure 3C. The pattern of increasing event rates with increasing score was confirmed in the external cohort of BOT-AcuteHF trial. The 1-year all-cause mortality increased in a stepwise manner for the four risk groups with a rate of 7% for the low-risk patients, 13% for the patients with a intermediate risk, 24% for the patients with a high risk and 52% for the very high-risk patients (p<0.001).
Discussion
The strong association between discharge plasma levels of NT-proBNP and adverse events in our study emphasises the important role of this biomarker for the prognosis of patients hospitalised for ADHF. We first determined optimally discriminative cut-off levels for NT-proBNP values at discharge as well as the percentage change during hospitalisation. Patients with higher levels of NT-proBNP at discharge, or an inadequate decline during hospitalisation, had a substantially higher risk of readmission and/or death within 180 days. Our results show that measurement of absolute NT-proBNP values at discharge, as well as the percentage reduction, adds important prognostic information to the initial evaluation of these patients and, therefore, should be considered as part of an early assessment of risk.
The risk markers
Previous studies have suggested that measurement of NT-proBNP can improve prognostication of patients admitted for ADHF.4 ,7–11 ,16 ,22 ,27 ,29 However, there has been an ongoing debate whether to use NT-proBNP values at discharge or the changes during hospitalisation in risk assessment.7 ,8 ,10 ,11 ,34 In our model, the absolute discharge NT-proBNP and the reduction percentage were entered and both proved to be the most powerful predictors of 180-day mortality. The incorporation of a combination of absolute NT-proBNP at discharge and percentage reduction levels into a model with established risk markers improved the risk stratification for adverse events within 180 days, as evidenced by a substantial and statistically significant increase in the C statistic, category less NRI and IDI.
Additionally, we included, age ≥75 years at admission, presence of peripheral oedema at admission, SBP ≤115 mm Hg at admission, hyponatremia at admission, serum urea of ≥15 mmol/L at discharge and NYHA class at discharge as independent risk markers in our multivariable model. Systemic hypotension has also been identified by others as a mortality predictor.15 ,16 ,31 ,35 Although higher SBP at admission was associated with a better outcome, it is clear that this does not necessarily mean that maintaining higher SBP during hospitalisation is beneficial. Higher SBP at admission may merely indicate that there is enough contractile reserve to allow a cardiac output and blood pressure response and, therefore, more room for therapeutic interventions, such as higher doses of β blockers and diuretics. Moreover, our results indicate once again the importance of hyponatremia and serum urea of ≥15 mmol/L in patients admitted for ADHF; previous studies have shown that regardless of the healthcare setting, ventricular function, or the timing of blood sampling, these biomarkers are associated with adverse events.15 ,16 ,30 ,36 Furthermore, established risk markers, such as LVEF ≤25%, cTNT values at admission and eGFR ≤30 mL/min/1.73 m² at discharge were not independently associated with 180-day mortality.8 ,9 ,16 ,31 ,37–39 This phenomena might, at least partly, be explained by the observation that NT-proBNP levels are strongly associated with LVEF, eGFR and cTnT levels in our study.
The regression model
An important difference between our model and other models used to predict HF mortality is the addition of sequential NT-proBNP measurement into the model. Five other regression models have been described for predict mortality in patients admitted for ADHF.14–18 However, two of these models were developed for in-hospital mortality and did not include postdischarge follow-up.15 ,18 Hence, this makes these models incomparable with our model. Of the remaining three models, two models were retrospective studies designed to predict mortality at 30 days16 ,17 and at 1 year.16 The fifth model, predicting mortality at 60 days, was limited to patients with left ventricular systolic HF, which does not represent the general population of patients admitted for ADHF.14 Patients with HF and preserved systolic function represent as much as 40% of the total HF population.40 Most importantly, unfortunately none of these previous models included NT-proBNP as a prognostic factor.
The ÉLAN-HF score
The variables used to construct ÉLAN-HF Score were derived from the Cox regression model that confirmed their independent predictive power after multivariate adjustment, incorporating for the first time the NT-proBNP levels at discharge and the reduction percentage in NT-proBNP during hospitalisation into the model. This simplified discharge risk score performs as well as the multivariable model, as evidenced by the marginal difference between the C-statistics. This also accounts for the model that uses the covariates with their raw uncategorised value. Hence, the simplification of the model does not imply a loss of information, and our risk score is a simple and effective way of classifying 180-day risk after discharge in patients hospitalised for ADHF. It goes without saying that the NT-proBNP level is the primary factor that drives the risk score. The patients with the lowest level are in the lowest categories of the risk score, while patients with the highest levels are in the highest categories. Nevertheless, the other risk markers in ÉLAN-HF Score do have a significant role, and they upgrade the patient at every stratum across the risk score to the next higher risk category. Recently, two risk models have been developed, including BNP values at discharge13 or the log of NT-proBNP level at discharge.41 However, both these models did not contain the changes of BNP or NT-proBNP during hospitalisation. Furthermore, one of these models was rather a small study, and the study population consisted only of patients with severe left ventricular dysfunction and advanced symptoms.13 Additionally, as the investigators of this study excluded patients with severe renal dysfunction and those requiring high doses of inotropes during hospitalisation, this could have altered the analysis, because these patients have worse outcome.13 ,14 The investigators of the other study developed a risk engine41 which was based on a complex modelling using continuous variables; all risk markers were treated as fixed-time covariates. They did not use straightforward cut-off levels, which make the risk engine complex and difficult to calculate. This makes the applications of the risk engine for clinical use unattractive and inconvenient. Thus, the strength of our model is its easy calculation, clinical application and broad applicability; it is applicable for patients with impaired as well as preserved LVEF, and regardless of therapies undergone during hospitalisation.
Validation of ÉLAN-HF score
ÉLAN-HF Score appears statistically robust in that the external validity of the risk score was confirmed in the validation cohort. It was validated in a separate cohort of patients from the BOT-AcuteHF trial. The observation of increasing 1-year mortality with increasing score confirmed the predictive proportional value of our risk score. Hence, ÉLAN-HF Score is a reliable risk score, which is predictive for death, and a composite endpoint of death and readmission within 180 days.
Limitation
Several limitations of our analyses should be acknowledged. The current study was an individual patient data meta-analysis, which was conceived after publication of the original studies. As each of the original studies was a prospective cohort study with dedicated predesigned data collection, this retrospective aspect of the study does not compromise the validity of our analysis. However, variation in treatment and inclusion criteria in the different centres should be considered. Nevertheless, this spread in NT-proBNP and therapeutic approach of patients as observed reflects the day-to-day clinical practice. Missing data should be considered as a limitation in our study. However, we did correct for the bias from data missing at random by using multiple imputation pooling algorithms, and it should be noted that for our most important variable, NT-proBNP, static and dynamic values were almost completely available. NT-proBNP level at discharge is the most important variable in our analyses, and a model and was available in 99% (n=1289) of the patients. In 97% (n=1266) of the patients, the NT-proBNP change during hospitalisation could be calculated. The clinical interpretation of NRI, and even more of IDI, may be difficult. It should be mentioned that the sum of the differences in the proportion of patient moving up minus the patient moving down or vice versa, quantifies the improvement in reclassification. Hence, it is important for the clinical interpretation that risk categories closely linked to decision making should exist because the NRI is highly sensitive to the number and choice of risk categories. Furthermore, for the external validation cohort, the NT-proBNP values at admission were not available. Instead, we used NT-proBNP values obtained 3 days before discharge as a proxy to calculate the dynamics of NT-proBNP during hospitalisation. Additionally, we compensated the relatively small sample size in the BOT-AcuteHF cohort by extending the follow-up duration to 1 year. In spite of these limitations, the predictive proportionality of our model was confirmed in the validation cohort. The ÉLAN-HF Score we developed has been limited to studies using NT-proBNP, since these were most numerously available having admission and discharge values (eight studies available for NT-proBNP against two studies for BNP). Nevertheless, the principle advantages of our score (ie, incorporating dynamic changes in a natriuretic peptide) are very likely equally applicable to BNP. However, since NT-proBNP values cannot be directly translated to a BNP value, the precise BNP values in such a score would need large databases to ascertain these. A recent study with BNP, the model with BNP at discharge best predicts 1-year mortality and/or rehospitalisation. However, this was a retrospective study, and was done only among older patients hospitalised with HF.42
Implication
ÉLAN-HF Score offers several promising applications for clinical use. The strength of our model is its broad applicability and also its easy calculation. It is easy to recall and apply clinically since straightforward cut-off levels were determined in lieu of more complex modelling using continuous variables. Moreover, variables in the current predictive model can be easily ascertained when a patient is hospitalised for ADHF. Furthermore, the incorporation of ÉLAN-HF Score in clinical practice could be accomplished quickly, since the measurement of NT-proBNP is already well established. Other novel new biomarkers may provide additional prognostic information and may need to be incorporated in future refinements of the risk score, as such measurements become more widely available. Although introduction of weighting markers for predictor variables or expansion of the list of predictor variables may lead to improvement in statistical measures of the predictive performance of the model (eg, C statistic), this is likely to occur at the cost of a loss of simplicity. Risk score development requires judgment to determine when a model predicts a sufficiently large gradient of risk to be clinically useful, and further refinement of the model produces unattractive levels of complexity.
Conclusions
Our results indicate that a simple discharge risk score incorporating NT-proBNP values at discharge as well as the dynamic change in NT-proBNP during hospitalisation enables the clinician to categorise a patient's risk at discharge to predict the event rate of death and a composite endpoint of death and readmission within 180 days. The novelty of the ÉLAN-HF Score is that absolute values at discharge and the reduction percentage of NT-proBNP significantly contributed to the risk score in contrast to previous established models which used only one of them or none at all. Since patients hospitalised for ADHF are at increased risk of adverse events and death, it is important to assess prognosis on an individual basis to formulate plans for evaluation and treatment. Nevertheless, the choice of therapy among a wide variety of treatment options, ranging from conservative to highly aggressive treatment, is often the most challenging question. Identifying a high-risk patient may call for more aggressive treatment and also for a much closer follow-up, possibly in a HF management programme. Therefore, a robust discharge risk gradation can, importantly, support treatment decisions and would be useful in identifying patients who need short-term, specialised re-evaluation following admission for ADHF. ÉLAN-HF Score is a simple yet robust discharge score to prognosticate patients within this notorious high-risk population.
Acknowledgments
We would like to thank Dr. Nan van Geloven for her help with the statistical analyses.
References
Supplementary materials
Supplementary Data
This web only file has been produced by the BMJ Publishing Group from an electronic file supplied by the author(s) and has not been edited for content.
Files in this Data Supplement:
- Data supplement 1 - Online appendix 1
- Data supplement 2 - Online appendix 2
Footnotes
-
Contributors KS, WEK and YMP had the idea for the project, designed the collaborative analysis, and undertook searches of published work. KS collected the individual patient data and prepared for analysis. Statistical analysis and elaboration of figures was done by KS, PD and JGT. MM, LB and VL provided us the external cohort to validate the risk score. KS wrote the paper with important contribution from JGT, WEK and YMP, and input from PB, MM and AB-G. LWE, JMP and VV provided valuable comments on the report. All principal investigators shared individual patient data and had an opportunity to contribute to the interpretation of results and to the redrafting of the report. All authors reviewed and revised the manuscript, and approved the final version.
-
Competing interests LWE and YMP received research funding for their original study from the Dutch Heart Foundation, Dutch Organisation for Scientific Research (NWO), the Royal Dutch Academy of Arts and Sciences (KNAW)—Interuniversity Cardiology Institute of The Netherlands, Pfizer, Astra-Zeneca, Medtronic and Roche Diagnostics. YMP is a recipient of payments for lectures including service on speakers bureaus and research grants from ROCHE Diagnostics. YMP has an unrelated biomarker patent and stocks in a University spinoff company. WEK receives grants from the Dutch Heart Foundation for an unrelated study. PB receives consultancy payments from Boeringher-Inglenheim, grants from the FCT- Portugues Science Foundation and payments for lectures including service on speakers bureaus from Servier. MM is a member of the board in Corthera and Novartis and receives payment for lectures including service on speakers bureaus, from Servier or Stroder. AB-G receives payments for lectures including service on speakers’ bureaus from Roche Diagnostics, Siemens and Rovi. All other authors have reported that they have no relationships to disclose.
-
Patient consent Obtained.
-
Ethics approval METC.
-
Provenance and peer review Not commissioned; externally peer reviewed.
Linked Articles
- Heartbeat