Article Text

Abstract
Objectives To assess differences in cardiovascular risk profiles among rural-to-urban migrants and non-migrant groups.
Methods Cross-sectional study in Ayacucho and Lima, Peru. Participants were: rural (n=201); rural-to-urban migrants (n=589); and urban (n=199). Cardiovascular risk factors were assessed according to migrant status (migrants vs non-migrants), age at first migration, length of residency in an urban area and lifetime exposure to an urban area.
Results For most risk factors, the migrant group had intermediate levels of risk between those observed for the rural and urban groups. Prevalence for rural, migrant and urban groups was 3%, 20% and 33%, respectively, for obesity, and 0.8%, 3% and 6% for type-2 diabetes. This gradient of risk was not observed uniformly across all risk factors. Blood pressure did not show a clear gradient of difference between groups. The migrant group had similar systolic blood pressure but lower diastolic blood pressure than the rural group. The urban group had higher systolic blood pressure but similar diastolic blood pressure than rural group. Hypertension was more prevalent among the urban (29%) than both the rural and migrant groups (11% and 16%, respectively). For HbA1c, although the urban group had higher levels, the migrant and rural groups were similar to each other. No differences were observed in triglycerides between the three groups. Within migrants, those who migrated when aged older than 12 years had higher odds of diabetes, impaired fasting glucose and metabolic syndrome compared to people who migrated at younger ages. Adjustment for age, sex and socioeconomic indicators had little impact on the patterns observed.
Conclusions The impact of rural-to-urban migration on cardiovascular risk profile is not uniform across different risk factors, and is further influenced by the age at which migration occurs. A gradient in levels was observed for some risk factors across study groups. This observation indicates that urbanisation is indeed detrimental to cardiovascular health.
- Diabetes
- hypertension
- epidemiology
- primary care
- public health
Statistics from Altmetric.com
Introduction
Chronic non-communicable diseases dominate the burden of disease statistics1 and are of growing concern in low- and middle-income countries.2 3 A recent consensus statement highlighted the need for data on the impact of urbanisation on chronic diseases.4 Urban areas of developing countries are growing much faster than rural areas,5–7 partly through migration from rural to urban areas. Thus, it is imperative to more fully understand the impact of urban migration on health.
Previous research on the health effects of migration has largely focused on movement between countries.8 Our knowledge and understanding of the health effects of migration from rural to urban areas within countries is less extensive. Because migration is often driven by economic and other factors that are likely to be related to health, migrants are often not representative of the rural area they come from, making valid comparisons between migrants and non-migrants difficult. During the period 1970 to the 1990s, mass migration from rural to urban areas occurred in Peru, triggered by political violence targeting rural dwellers.9 10 This meant that the usual selection effects that lead to migrants being an atypical group were reduced for two reasons. First, in affected areas, large proportions of the population migrated. Second, the key factor leading to migration was to escape from violence rather than economic forces. Particularly given the marked contrast between urban and rural lifestyles, Peru therefore offers a unique opportunity to assess the health effects of migration to urban areas. This study aimed to assess differences in cardiovascular risk profiles among migrants and non-migrant groups.
Methods
Study design
The study was a cross-sectional survey conducted in 2007–08 of three population-based groups: rural, people born in Ayacucho who had always lived in a rural environment; rural-to-urban migrants, people born in Ayacucho who had migrated from rural to urban areas and were currently living in Lima; and urban, people born and currently living in Lima. Details of the study design have been reported elsewhere.11
Setting
The village of San Jose de Secce (Santillana district, Huanta province) in Ayacucho was selected as the rural study site. This area, located in the Andes, was one of the most severely affected areas during this period of violence and was thus an area where a large proportion of the population migrated to urban areas.9 12 According to Peru's 2007 census, this district had a population of 7215 people: 91% of them live in a rural area, 97% learnt a native language during childhood, and only 3.4% were classified as migrants defined by place of birth.13
The area called ‘Las Pampas de San Juan de Miraflores’ in Lima, a periurban shantytown in the south of Lima, was selected as the urban area for the study. This area was chosen because it is a typical shantytown where migrants from rural areas have settled over the years, and migrants from the southern part of Peru, including Ayacucho, are more likely to settle in San Juan de Miraflores. Both urban and rural-to-urban migrant participants were selected from this area. In 2007, the total population of the district of San Juan de Miraflores was 362 643 people: 100% urban, 11% learnt a native language during childhood, and based on place of birth, 50% were classified as migrants.13
The distance between these two settings chosen for the study, rural and urban, is about 310 km. However, due to the mountainous-type of geography of the Andes, the travelling distance to connect these two sites is 12–15 h by land transportation, varying between the rainy and dry seasons.
Participants
A single-stage random sampling method was used in all groups. In the case of San Jose de Secce in Ayacucho, a census was conducted in mid-2007. The sampling frame for the urban group was derived from the local census, conducted in the year 2000, which was updated in 2006 to identify all those who had been born in the department of Ayacucho and were currently living in Lima. From these updated censuses, the sampling frame of adults ≥30 years old was 398, 1785 and 4621 for the rural, rural-to-urban migrant and urban groups, respectively.11
For all study groups, individuals from both sexes aged 30 years old and over, permanently living in their residence were considered eligible. Pregnant women, because of their transient physiological state, and those with mental disorders judged likely to impair survey completion were excluded. Language was not considered an exclusion criterion to take part in the study; some of our fieldwork personnel in Lima and all of them in Ayacucho were fluent in Quechua. Participants' selection was stratified by 5-year age groups and sex. The study target was to recruit a total of 1000 people: 200 people each in the rural and urban groups, and 600 migrants.
Study variables
The primary exposure was migration from a rural to an urban environment, defined by study group—that is, rural, rural-to-urban migrant and urban groups. The migrant group was subsequently divided to explore whether the pattern of cardiovascular risk factors in the migrant population varies by age at first migration (aged ≤12 years old when first migrated vs >12 years old), length of residency in an urban area (<20, 20–29, 30–39 or ≥40 years in urban area) or lifetime exposure to an urban area (number of years lived in an urban area divided by current age, in quartiles).
Cardiovascular disease (CVD) risk factors investigated included systolic blood pressure (SBP) and diastolic blood pressure (DBP) (mean of last two of three measures), hypertension (SBP ≥140 mm Hg or DBP ≥90 mm Hg, or self report of physician diagnosis and currently receiving antihypertensive medication14 15), body mass index (BMI), obesity (BMI ≥30 kg/m2), overweight or obesity (BMI ≥25 kg/m2), skinfolds and waist-to-hip ratio, fasting glucose, diabetes (fasting glucose ≥126 mg/dl (≥7 mmol/l)16 or self report of physician diagnosis and currently receiving antidiabetic medication), impaired fasting glycaemia (IFG) or diabetes (fasting glucose ≥110 mg/dl (≥6.1 mmol/l)), lipoprotein profile, hypercholesterolaemia (total cholesterol ≥200 mg/dl (≥5.2 mmol/l)), inflammatory markers (C reactive protein (CRP), fibrinogen), insulin resistance and metabolic syndrome. A current smoker was defined as having smoked within the last 6 months with a lifetime total of more than 100 cigarettes.
Socioeconomic factors—educational level, household income, number of people per room and asset possession17—were assessed and the number of adverse factors combined into a deprivation index, as a marker of adulthood socioeconomic position.18 Paternal and maternal education levels were combined into highest parental education as a proxy for childhood socioeconomic position. These markers were considered a priori to be potential confounder variables.
Skinfolds were measured at four sites (biceps, triceps, subscapular and suprailiac) to the nearest 0.2 mm using a Holtain Tanner/Whitehouse skinfold caliper. For skinfold, and waist and hip circumference, three measurements were taken and the average used.
Fasting glucose, fasting insulin and glycosylated haemoglobin (HbA1c) were measured in plasma, serum and whole blood, respectively. All blood samples were analysed in a single facility. For quality assurance, the quality of assays was checked with regular external standards and internal duplicate assays and monitored by BioRad (http://www.biorad.com). Insulin resistance was calculated using the HOMA calculator,19 excluding those with diabetes. Metabolic syndrome was defined according to the recent 2009 unified definition adopted by several major organisations.20
In accordance with the International Physical Activity Questionnaire protocol, the categorical physical activity levels (low, moderate, high) were coded based on total days of physical activity and metabolic equivalents (MET) in minutes/week.21 Moderate physical activity was coded as 5 or more days of any combination of walking, or moderate-intensity or vigorous-intensity activities achieving at least 600 MET minutes per week. High physical activity was coded as 7 or more days of any combination of walking, or moderate-intensity or vigorous-intensity activities achieving a minimum total physical activity of at least 3000 MET minutes/week. Sedentary physical activity was defined as less than 150 MET minutes in one week.21
Statistical methods
Continuous non-normally distributed variables were log-transformed, leading to normal or near normal distributions, and age- and sex-adjusted arithmetic means (±SD) or geometric means (ratios)22 23 were calculated. Direct standardisation to the WHO standard population24 was used to calculate age-standardised prevalences by specific age groups (five yearly age groups: 30–34, 35–39, 40–44, 45–49, 50–54, 55–59, ≥60 years old).
Multivariable logistic regression and linear regression were used for categorical and continuous outcomes, respectively. Three core models were as follows. Model 1 was adjusted for age, sex, individual socioeconomic deprivation and highest parental education. Model 2 added BMI and model 3 added physical activity. For the analysis of coefficients, adjustment for treatment effects, for example antihypertensive therapy on blood pressure outcomes, was undertaken using censored normal regression.25 For continuous outcomes, to enable comparisons between risk factors, standardised mean differences (SMD) were calculated by linear regression using the SD for each group. Interpretation of SMDs followed the convention of 0.2 SMD representing a small effect, 0.5 a moderate effect, and 0.8 a large effect.26 27
Results
Response rate at enrolment was 73.2% (1176/1606) and overall response rate at completion of the study was 61.6% (989/1606).11 The final sample size of 989 comprised 52.8% women. A higher proportion of refusals was observed among men in the urban group and among older people (>60 years old) in all study groups. In the urban group, more urban non-responders had completed secondary level education (70.3% compared to 56.6% in urban responders). No differences in self reported diagnosis of diabetes or hypertension were seen between response groups. In relation to migration indicators, non-responder migrants' median age at first migration was similar to that of responders. Both individual socioeconomic reasons (studies or working reasons) and terrorism were listed among the two main reasons for migration in both responders and non-responders.11
The distribution of socio-demographic indicators, profile of migrants and distribution of cardiovascular risk factors by migration status are shown in tables 1, 2 and 3, respectively. The rural group was the most socioeconomically disadvantaged, followed by the migrants. As figure 1 shows, the majority of the rural population had no risk factors and the majority of migrants had none or at least one risk factor. A gradient of doubling prevalence was observed for current smoking status but this was not necessarily accompanied by greater cigarette consumption (table 1).
Demographic and socioeconomic variables by migration status
Distribution of migrants by patterns of migration
Distribution* of cardiovascular risk factors by migration status

Number of major cardiovascular disease (CVD) risk factors by migration status. Major risk factors considered were smoking, hypertension, diabetes, obesity and hypercholesterolaemia (defined as total cholesterol ≥200 mg/dl or ≥5.2 mmol/l). The aggregations shown correspond to the sum of ‘Yes’ of each individual risk factor and range from zero (no risk factors) to 4 (presence of four risk factors concomitantly).
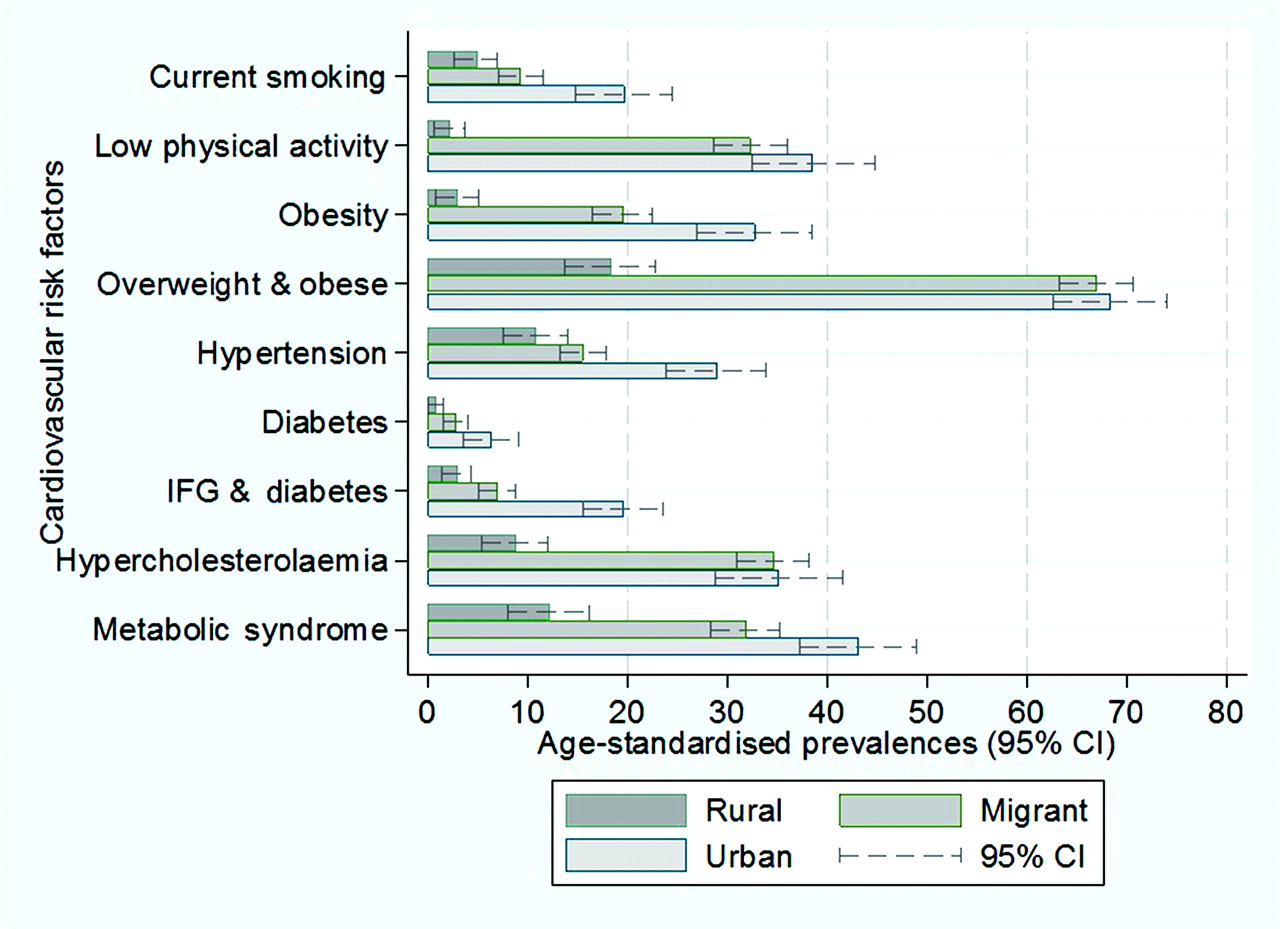
Obesity was markedly low in the rural group. Overweight and obesity prevalences were over 65% in both migrant and urban groups, as shown in figure 2 (see also supplementary table 1). In multivariable regression, after adjustment for age, sex and socioeconomic factors, all anthropometric measurements were consistently higher in migrant and urban groups compared to the rural group (see supplementary table 1). In the case of the sum of all skinfolds, migrants and urban people were on average 34.8 mm (95% CI 29.5 to 40.1) and 45.8 mm (95% CI 39.3 to 52.3) units higher compared to the rural group (see table 4). As shown in figure 3, the magnitude of the differences in anthropometric risk factors was substantial, ranging between 0.5 and 2 SD units higher in both migrant and urban people when compared to the rural group. Further adjustments for BMI and physical activity only mildly attenuated most of the outcome estimates, but two exceptions were noted. First, further adjustment decreased the effect sizes observed in insulin and HOMA-IR. Second, high density lipoprotein (HDL) changed from zero to a range of differences of 0.2 to 0.3 SD units (figure 3 and supplementary table 2).

Prevalence (age-standardised to WHO standard population) of cardiovascular disease risk factors by migration status; p for trend in all cases <0.01.
β coefficients (95% CI) of continuous normally distributed cardiovascular risk factors by migration status

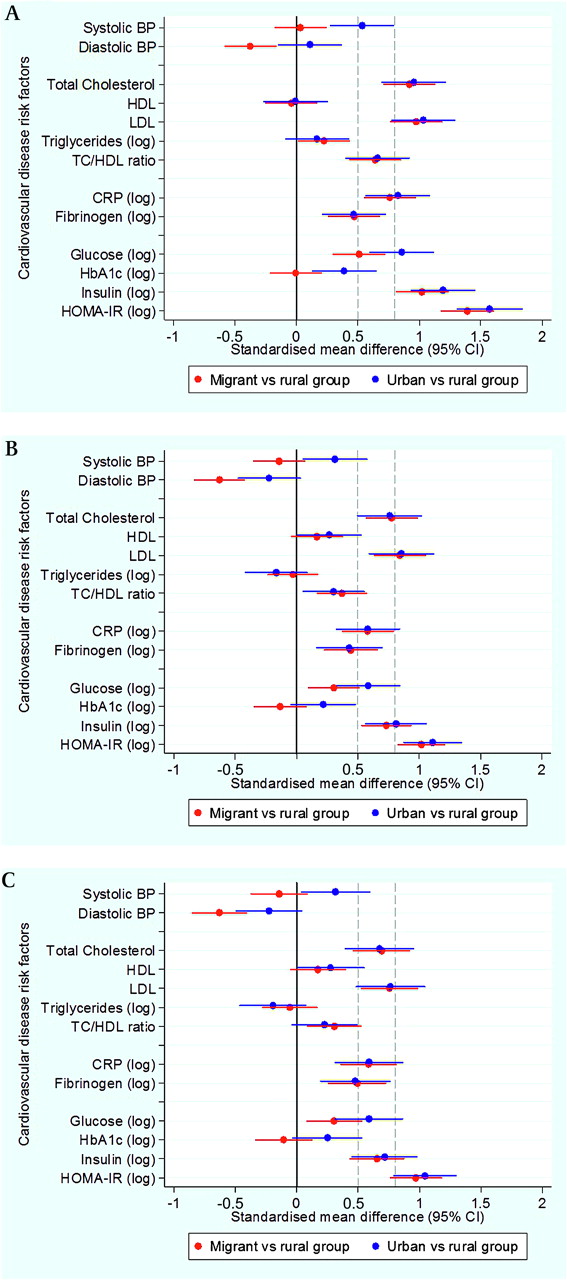
Adjusted standardised mean differences in cardiovascular disease risk factors in migrant and urban populations compared to the rural population. (A) Standardised mean differences adjusted for age, sex, socioeconomic position and parental education. (B) Standardised mean differences adjusted for age, sex, socioeconomic position, parental education and body mass index. (C)Standardised mean differences adjusted for age, sex, socioeconomic position, parental education, body mass index and levels of physical activity. The solid line at zero indicates no difference compared to the rural group. Additional dashed lines at 0.5 and 0.8 correspond to thresholds for moderate and large differences, respectively.
For most risk factors migrant and urban groups were similar and had significantly higher levels than the rural group. One of the exceptions was blood pressure, which despite showing a gradient from rural to migrant to urban in terms of age-standardised prevalences (figure 2), no difference was observed between rural and migrants in SBP (β coefficient 0.7 mm Hg). However, migrants had a DBP on average −3.4 mm Hg (95% CI −5.4 to −1.4) lower than that of the rural group. Compared to the rural group, the urban group had higher SBP but similar DBP and further adjustment for BMI and physical activity did not change this observation (table 4 and figure 3).
For lipid measures and inflammatory markers, migrants were generally similar to the urban group. However, differences between groups in triglycerides were small (table 4 and figure 3). After multivariable adjustment and compared to the rural group, both migrant and urban populations had significantly higher geometric means of CRP (table 5). The CRP geometric means of migrant and urban groups were 196% and 224% greater than the geometric mean of the rural group, respectively. In the case of fibrinogen, the geometric mean of the migrant and urban groups was 11% greater than the geometric mean of the rural group.
Geometric mean (95% CI) and ratios (95% CI) of non-normally distributed cardiovascular risk factors by migration status
In terms of fasting glucose and compared to the rural group, both migrant and urban groups had higher geometric mean ratios of 9% and 16% higher, respectively. In the case of HbA1c there was no difference between migrant and rural populations, and the urban group had a slightly higher average value (table 5). Compared to the rural group, fasting insulin and insulin resistance were markedly higher in the migrant group (in the range of 200% greater) and the urban group (around 250% greater) (table 5), and were reflected as substantial effect sizes between 1 and 1.6 SD units with some attenuation following adjustment for BMI and physical activity (figure 3 and supplementary table 2).
All cases of diabetes were type-2 as none of the participants reported type-1 diabetes mellitus. A gradient was observed in age-standardised prevalence of diabetes (0.8% to 2.8% to 6.3%) and IFG and diabetes (2.9% to 6.9% to 19.5%). Occurrence of metabolic syndrome was consistently higher in migrants and in urban groups (figure 2 and supplementary table 1). ORs for diabetes, IFG and diabetes and metabolic syndrome were substantially high but their CIs were wide. Further adjustment for BMI and physical activity showed different directions on these estimates in migrant and urban groups: it gradually increased the odds of diabetes but attenuated the odds of metabolic syndrome (figure 4 and supplementary table 3).

Adjusted ORs for cardiovascular disease (CVD) risk factors in migrant and urban populations compared to the rural population. (A) Odds ratios adjusted for age, sex, socioeconomic position and parental education. (B) Odds ratios adjusted for age, sex, socioeconomic position, parental education and body mass index. (C) Odds ratios adjusted for age, sex, socioeconomic position, parental education, body mass index and levels of physical activity.
Pattern of migration
Separate analyses, adjusting for multiple confounders, explored whether the pattern of CVD risk factors in the migrant group varied by length of residence in urban environment, lifetime exposure to urban environment or age at first migration (see table 2). No consistent pattern of variation in cardiovascular risk factors was observed using migrants' sub-classifications (supplementary table 4 to 7), apart from glucose- and obesity-related variables.
Compared to those who migrated when under 12 years of age, those who migrated aged 12 years or older had 3% and 2% higher geometric mean ratio of blood glucose and HbA1c, respectively. In the adjusted models, they had higher odds of: diabetes, OR 7.05 (95% CI 0.9 to 55.48); IFG or diabetes, OR 6.07 (95% CI 1.36 to 27.06); and metabolic syndrome, OR 1.66 (95% CI 1.08 to 2.57).
Those with a longer period living in an urban area had higher odds of obesity, three to four times more. There was weak evidence that longer periods of residence in an urban area (20+ years vs <20 years) was associated with increased levels of HOMA insulin resistance but these were attenuated with further adjustment by BMI and physical activity. This pattern was not observed in those migrants by length of exposure to urban environment, where the higher odds of obesity and overweight were only present for the second quartile.
Discussion
Main findings
This study assessed three groups in Peru: migrants from a rural to an urban area; people who had remained in the rural area; and people who had always lived in the urban setting. A wide range of cardiovascular risk factors were assessed including anthropometry, blood pressure, lipids, glycaemia, and metabolic and inflammatory markers. For most risk factors, the profile of migrants is close to that observed among an urban group or is intermediate between the levels seen among rural and urban groups. However, there were notable exceptions to this pattern. For blood pressure and HbA1c, values for migrants were similar to those seen in the rural group, while the urban group had substantially higher levels. For triglycerides and HDL cholesterol, there was little difference between any of the groups. The findings challenge a simple view that following migration, risk factors uniformly converge to that of the host urban population.
Strengths and limitations of the study
Our results complement, and expand to other regions, the recent observations arising from India on the impact of rural-to-urban migration.28 In most studies economic factors determine migration, resulting in selection bias which is an important concern.29 Due to the unique circumstances of the Peruvian context, where a forced migration process occurred, the whole population had strong pressures to migrate. Rural and urban control groups were defined a priori to match the rural area of origin of most migrants as well as their urban destination. A separate analysis30 of this sample, addressing the issue of selection bias using both the instrumental variable method and propensity score matching, showed no differences between the migrant and the rural groups. Number of deaths by political violence, which strongly affected the study area, was used as an instrument. In addition, based on observable covariates, propensity score matching helped to mimic an experimental setting. The results from both methods suggested that selection bias did not influence our study findings, and thus the observations reported contribute to expanding our knowledge of the impact of rural to urban migration in low- and middle-income settings.30 Ideally, longitudinal measures would be made starting prior to migration and repeated for several years to examine the evolution of risk factor changes with migration. Such a design is seldom feasible and although a cross-sectional design was used in this study, it is likely that a large part of the differences observed is attributable to the effects of migration. Of note, migrants in this study moved to and remained in a low socioeconomic area, so its findings may not generalise to the overall effect of migration considering the minority group within migrants who migrate to better areas.
Comparison with previous research
Relatively few studies have addressed the impact of rural-to-urban migration on cardiovascular disease outcomes in low- and middle-income countries. For blood pressure, while results have been somewhat inconsistent, in general studies have observed higher blood pressures —both systolic and diastolic—among people who have migrated to urban areas compared to their rural counterparts.31–38
The observation from this study that migrants from a wide age range, after a sustained process of migration and establishment into an urban environment for a number of years—a median of 32 years (IQR 25–39) in an urban environment11—maintain a similar SBP to their rural counterparts, has not, to the best of our knowledge, been previously reported. However, findings of a surprising decrease in BP following migration in a much younger cohort and within 6 months of migration have recently been reported in Tanzania.39 As suggested by Unwin et al, these findings ‘suggest that the pattern of change on rural to urban migration may be more complex than commonly thought and is worthy of further study’.39
In our study, the prevalence of type-2 diabetes was 0.8%, 2.8% and 6.3% in the rural, migrant and urban populations, respectively. These findings of gradients are broadly similar to those seen in previous studies.38 40–43 Similarly, higher HbA1c levels have been reported in urban compared to rural settings in China and Fiji.44 45 Given our findings on diabetes however, the lack of difference in HbA1c between rural and migrant groups is surprising and to our knowledge has not previously been observed. These findings pose additional challenges to and signals to potential shortcomings of current recommendations seeking to consider HbA1c as a diagnostic criterion for diabetes.46
Our finding that age at migration accounts for some of the variability in cardiovascular risk among migrants suggests that urban living has a heterogeneous impact on physiology. The effects of change in dietary patterns and stress may occur quite rapidly following migration, and this may account for the similar blood lipid and CRP profiles of migrant and urban populations. Other components of risk may more strongly reflect developmental experience, with a longer period during childhood spent in rural conditions conferring a degree of protection against adult risk, as is plausible for blood pressure. These findings indicate that migration may be particularly detrimental later in life, perhaps because stronger long-term physiological effects may be generated during the more plastic earlier period of growth.47 Although requiring confirmation in other settings, these differential findings according to the age profile of migration raise further question on the role and long-term impact of migration on the development of chronic conditions, particularly in low- and middle-income countries. The study by Colon-Lopez on elder Mexican migrants to the USA found that those who migrated before age 20 had greater rates of cardiovascular mortality.48 Although different outcomes were studied, the directionality of these observations differs from what it is suggested by our results. The observations arising from this Mexican migration study are not necessarily comparable to ours as the migration was not necessarily a rural-to-urban process, and, as clearly noted by the authors, those who migrated before the age of 20 years had higher income and education, were more likely to speak English, and were culturally more Anglo.48
Importance of the study findings
The PERU MIGRANT study highlights a few observations relevant for the assessment of chronic non-communicable diseases in Peru and other low- and middle-income countries. First, the profile of cardiovascular risk factors is different in the groups studied, thus showing the negative impact of migration and urbanisation on cardiovascular health as demonstrated by the similar metabolic and anthropometric profiles between migrant and urban populations. Second, the magnitude of difference between risk factors is not uniform across risk factors. The latter observation is demonstrated by the fact that some metabolic outcomes in migrants behave pretty much in the same way as in the urban population but blood pressure does not. Third, the finding that age at migration accounts for some of the variability in cardiovascular risk in the migrants suggests that urban living has a heterogeneous impact on physiology. The impact of migration appears less if it occurs before 12 years of age, suggesting that adaptation is more successful if it is initiated during childhood rather than adolescence. This may be because of greater physiological plasticity during childhood which may aid the alignment of homeostatic physiology with the development of body size and metabolic load.47
Studies like PERU MIGRANT describing such unexpected heterogeneity in the profile of cardiovascular risk between groups are key to the understanding of the epidemic of non-communicable diseases in low- and middle-income countries. This heterogeneity adds to views proposed by Geoffrey Rose, in his classic ‘Sick individuals and sick populations’ paper,49 that prevention may be feasible at the population level and that, at least in Peru, genetic factors may not be the only factor in explaining the totality of differential cardiovascular risk.
Together with the PREVENCION study—conducted solely in a middle-class urban city in another Andean area50 51—this is one of largest comprehensive CVD studies conducted in Peru to date. Unlike the PREVENCION study, this study took advantage of rural and urban residents. Findings from this study contribute to fill the massive knowledge gap on non-communicable diseases and CVD in low- and middle-income countries as currently advocated.52 53 As Yusuf et al pointed out, there is urgent need to better document current rates—incidence and prevalence—of CVD mortality and morbidity in low- and middle-income countries in order to properly assess burdens and future projections.53 In the same vein, Unwin et al argue for improved surveillance of all diseases in order to place non-communicable diseases properly within the context of the overall burden of disease.54
These findings can inform other similar low- and middle-income countries, but also challenge the adoption and incorporation of research findings from developed countries, particularly in CVD epidemiology,55 to other low- and middle-income country settings without prior knowledge of the risk profile of such populations.
Conclusions
The reduction of risk of chronic disease among rural to urban migrants in low- and middle-income countries presents one of the major challenges to public health in the 21st century. An important finding of this study is that for some risk factors there seems to be a gradient in levels across the three groups which do not appear to be explained by age, sex, socioeconomic position, BMI and physical activity differences. This observation indicates that urbanisation is indeed detrimental to cardiovascular health. Following on from this, an additional observation derived from this study is that the impact of migration on cardiovascular risk profile is not uniform across risk factors, and is further influenced by the age at which migration occurs. In low- and middle-income countries, prevention strategies delivered in urban areas—presumably designed for urban dwellers—may need to be tailored to the needs of rural-to-urban migrants.
Acknowledgments
Professor David A Leon and Professor Shah Ebrahim, both at the London School of Hygiene and Tropical Medicine, provided critical input at the design phase and throughout the study, and carefully revised the manuscript. Professor Héctor H García at UPCH provided direct advice for the various phases of the study in Peru. Valerie McCormack, Juan Pablo Casas and Pablo Perel (LSHTM) advised on data analysis. Jonathan C K Wells (Institute of Child Health, University College London) and Victor M Montori (Mayo Clinic) provided critical comments to the interpretation of the data. Our special gratitude is extended to various colleagues at Universidad Peruana Cayetano Heredia and A.B. PRISMA in Lima, Peru and several others in the UK, as well as to the staff and the team of fieldworkers that contributed to different parts of this study. Most importantly, our sincere gratitude is extended to the people that agreed to take part in the study, and to Juan Francisco Chiroque, Candice Romero and Lilia Cabrera who coordinated the fieldwork phase of this study.
References
Supplementary materials
Web Only Data hrt.2010.218537
Files in this Data Supplement:
Footnotes
A data sharing technical appendix, statistical code and dataset available from the corresponding author at jaime.miranda{at}upch.pe or jaime.miranda{at}lshtm.ac.uk. Consent for data sharing was not obtained but the presented data are anonymised and risk of identification is low.
Funding This work was funded in whole by the Wellcome Trust (GR074833MA). LS is supported by a Wellcome Trust Senior Research Fellowship in Clinical Science. The CRONICAS Center of Excellence in Chronic Diseases at UPCH is funded by the National Heart, Lung and Blood Institute (NHLBI), National Institutes of Health, Department of Health and Human Services, under contract No. HHSN268200900033C. The funder had no role in study design, data collection, analysis or interpretation; in writing the report; or in the decision to submit the article for publication. The researchers are all independent from the funding source.
Competing interests None.
Patient consent Obtained.
Ethical approval Ethical approval for this protocol was obtained from ethics committees at Universidad Peruana Cayetano Heredia in Peru and the London School of Hygiene and Tropical Medicine in the UK. The purpose of the study was explained to each of the study participants and written informed consent was obtained.
Provenance and peer review Not commissioned; externally peer reviewed.