Article Text

Abstract
Objective Discrepancy in the echocardiographic severity grading of aortic stenosis (AS) based on current guidelines has been reported. We sought to investigate the left ventricular outflow tract diameter (LVOTd) as a source of inconsistencies, and to explore hypothetical alternatives for discrepancy improvement.
Design Retrospective echocardiographic cross-sectional analysis.
Setting From 2000 to 2010, we identified all AS patients with left ventricular EF ≥50%, mean gradient (MG) ≥20 mm Hg, aortic valve area (AVA) ≤2.5 cm2, <moderate (2+) aortic regurgitation; and divided them into three groups: patients with ‘small ’ LVOTd 1.7–1.9 cm, ‘average’ LVOTd 2.0–2.2 cm and ‘large’ LVOTd ≥2.3 cm. In each group, inconsistency of data for classification of severity of AS was assessed and alternative thresholds explored.
Results Of 9488 total patients, 58% were men, LVOTd 2.18±0.19 cm, peak velocity (Vmax) 3.9±0.8 m/s, MG 37±16 mm Hg, and AVA 1.09±0.34 cm2. Small LVOTd patients were older women (91%) with worse systemic haemodynamics and more prevalent paradoxical low-flow, compared with average and large LVOTd patients (all parameters p <0.001). Despite clinically similar MG and Vmax across all groups, mean AVA ranged from 0.88 to 1.25 cm2 (p <0.001), classifying small LVOTd patients as severe, average LVOTd as moderate-severe and large LVOTd as moderate. For patients with large, average and small LVOTd, an AVA of 1 cm2 corresponded to MG of 42, 35 and 29 mm Hg, Vmax of 4.1, 3.8 and 3.5 m/s and dimensionless index (DI) of 0.22, 0.29 and 0.36, respectively. An AVA cut-off of 0.8 cm2 reduced severe AS inconsistency from 48% to 26% for small LVOTd patients. An AVA cut-off of 0.9 cm2 reduced severe AS inconsistency from 37% to 26% for average LVOTd patients. The current AVA cut-off of 1 cm2 was consistent for large LVOTd patients.
Conclusions The LVOTd is associated with significant inconsistencies in AS assessment by current guidelines. For patients with normal EF and normal flow, current guideline definition of severe AS is most consistent for patients with large LVOTd, but not so for patients with average or small LVOTd in whom lower AVA cut-offs should be further studied. The DI cut-off for severe AS is highly variable depending on the LVOTd and guideline revision of this threshold should be considered.
Statistics from Altmetric.com
Introduction
Aortic stenosis (AS) is the most common valvular disease referred for surgical treatment.1 ,2 Echocardiography is the state-of-the-art method of AS severity evaluation.3 Current US guidelines define severe AS as a continuity equation-derived valve area (AVA) <1 cm2, indexed valve area (AVAi) <0.6 cm2/m2, mean gradient (MG) >40 mm Hg, and peak velocity (Vmax) >4 m/s.4 European guidelines define severe AS as AVA <1 cm2 or AVAi <0.6 cm2/m2, and MG >50 mm Hg.5 The AVA is considered outcome-predicting in AS,3 and it is universally utilised. The most influential component of the continuity equation calculation is left ventricular outflow tract diameter (LVOTd), since its value is squared. With careful attention to technical detail, the LVOTd can be measured in most patients.3 When the LVOTd is not available, the dimensionless index (DI) is recommended alternatively to determine AS severity.4 A DI of <0.25 by Vmax or TVI (time-velocity integral) is considered an indicator of severe AS. Since critical clinical decisions are made based on these parameters, their consistency has been studied. Minners et al6 ,7 found inconsistent AS severity grading by echocardiography in one out of three patients, and one out of four patients by catheterisation. The reasons for these inconsistencies are not completely understood. We sought to explore the LVOTd as a source of variation in echocardiographic grading of AS severity in a large cross-sectional patient group, and explore hypothetical alternatives for discrepancy improvement.
Methods
Patients
We retrospectively searched the institutional echocardiographic database for transthoracic ECGs performed between January 2000 and December 2010 at the Mayo clinic, Rochester, Minnesota, USA. Inclusion criteria were age ≥18years, left ventricular ejection fraction (LVEF)≥50%, MG ≥20 mm Hg, AVA ≤2.5 cm2, aortic regurgitation<moderate (2+), mitral regurgitation ≤moderate, and heart rate between 60 and 90 bpm. In patients with more than one ECG, only the latest (most recent) ECG was used for analysis and previous studies were excluded. We divided patients into ‘small’ (1.7–1.9 cm), ‘average’ (2.0–2.2 cm) and ‘large’ (≥2.3 cm) LVOTd. In each group, inconsistency of AVA, Vmax, MG and DI data for classification of severity of AS was assessed. Different severe AS AVA cut-offs were then tested by LVOTd, analysing the reassignment of patients to different AS severity categories. The protocol was approved by the Mayo Clinic institutional review board.
Echocardiography
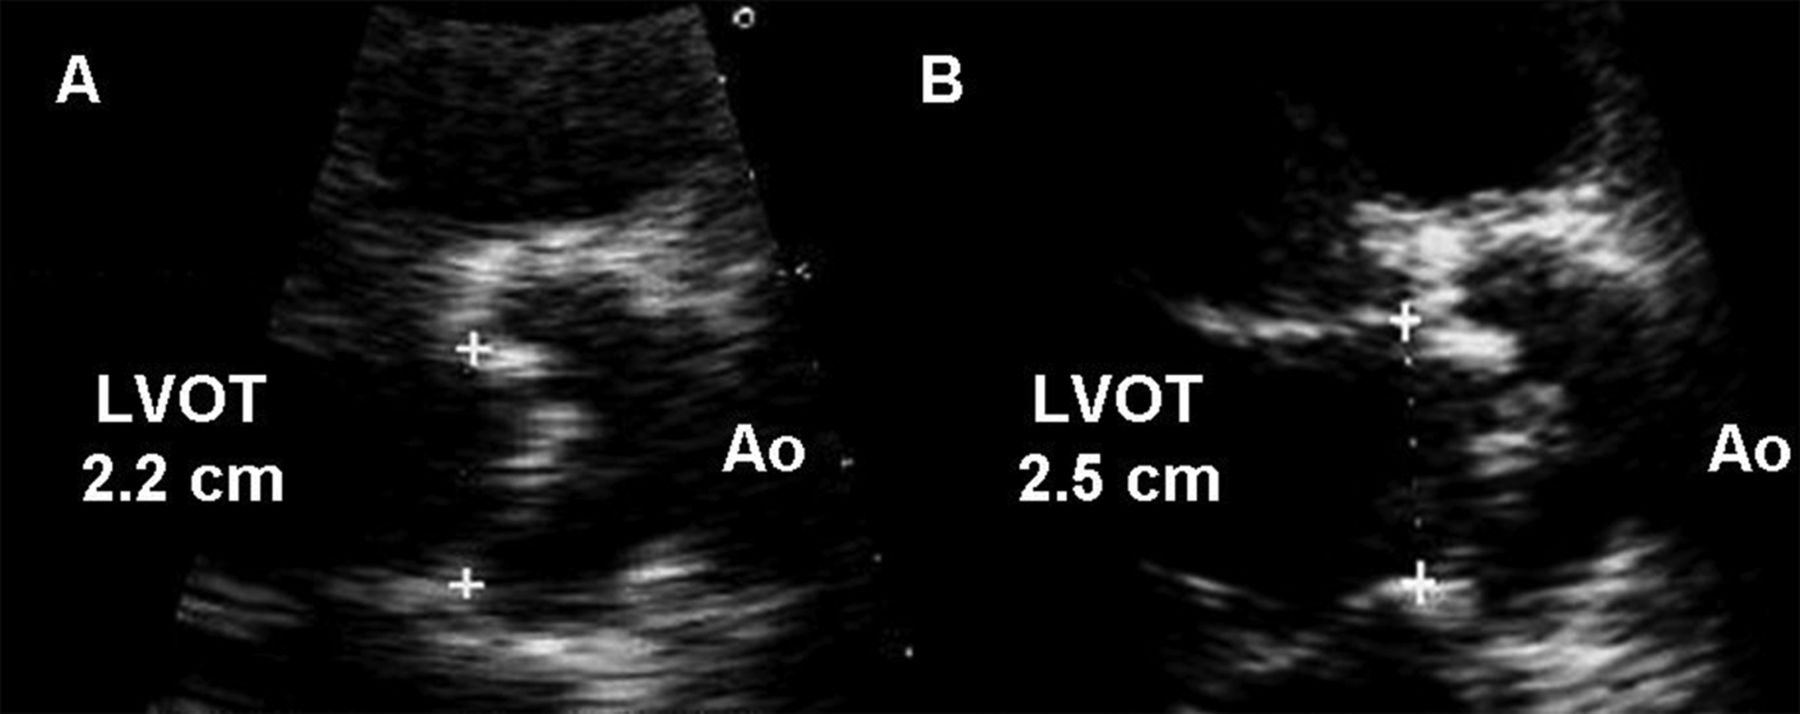
All patients underwent comprehensive 2-dimensional and Doppler transthoracic echocardiographic evaluation with state-of-the-art technology. Blood pressure was measured by arm-cuff sphygmomanometer simultaneously with heart rate at the time of echocardiography. LVEF was assessed with 2-dimensional echocardiography8 and visual estimation if orthogonal measurements could not be obtained.9 Left ventricular end-diastolic diameter (LVEDD) and end-systolic diameter (LVESD) were obtained, inner edge to inner edge, in the parasternal long-axis view using a freeze-frame at the largest diameter (LVEDD) and smallest diameter (LVESD) of the minor heart axis. Aortic valve pulsed wave and continuous wave Doppler measurements and recordings were performed according to best practice,3 ,10–12 with measurement average of three beats in sinus rhythm and 5–10 beats in atrial fibrillation. With appropriate gain and processing adjustments, the LVOTd was measured in the parasternal long-axis view using a zoomed freeze-frame at early to mid-systole, inner edge to inner edge, from where the anterior cusp meets the ventricular anteroseptum, to the point where the posterior cusp meets the anterior mitral leaflet12 (figure 1). Multiple measurements were made in all patients with immediate physician review and, if necessary, repeat LVOTd measurements. LVOT-TVI was obtained after proper cursor alignment to the aortic flow, in the apical long-axis view, with sample volume placed above the colour-flow prestenotic acceleration aliasing zone (0.5–1 cm above the aortic annulus) in order to record a laminar Doppler envelope without spectral dispersion.3 ,12 AVA-TVI, Vmax and MG were determined by systematic search of the highest values in all possible windows (apical, subcostal, supraclavicular, suprasternal and right parasternal), with the non-imaging continuous-wave probe. Valvular regurgitation was assessed according to state-of-the-art guidelines.13 ,14

Representative left ventricular outflow tract diameter (LVOTd) measurements in a patient with aortic stenosis. (A) Shows underestimation of the LVOTd due to inappropriate gain and processing adjustments. (B) Shows appropriate LVOTd measurement with accurate visualisation of cusp insertion points.
Basic haemodynamic parameters
Stroke volume (SV) was calculated as SV=LVOTd2×0.785×LVOT-TVI, stroke volume index (SVI) as SVI=SV/BSA, right ventricular systolic pressure (RVSP) as RVSP=4×peak tricuspid regurgitation velocity2+estimated right atrial pressure.12
Systemic haemodynamics
Systemic arterial compliance (SAC) was calculated from the ratio of SVI and pulse pressure (PP) as SAC=SVI/PP.15 Systemic vascular resistance (SVR) was estimated from mean arterial pressure (MAP) and cardiac output (CO) as SVR=80×MAP/CO.16
LV calculations
LV mass was calculated as LV mass=1.04×{((LVIDd+LVPWd+IVSd)3−(LVIDd)3)×0.8}+0.6 gm,17 LV mass index=LV mass/BSA, and LV hypertrophy (LVH) represented as LV mass index >115 in men or >95 in women.17 Relative wall thickness was calculated as relative wall thickness (RWT)=2 PWTd/LVEDD,17 where PWTd is the posterior wall diastolic thickness.
AS severity assessment
The aortic MG, Vmax and AVA were automatically calculated by echocardiographic software. AVA was calculated as AVA=LVOTd2×0.785×LVOT-TVI/aortic valve (AV)-TVI, AVAi as AVAi=AVA/BSA, DI as DI=LVOT-TVI/AV-TVI.
Additional AS assessment
Valvulo-arterial impendance (Zva) was estimated as Zva=(SBP+MG)/SVI, where SBP is systolic arterial pressure.16 Energy loss index (ELI), calculated as ELI=(AVA×Aa/Aa-AVA)/BSA; where Aa is the aortic cross-sectional area obtained from the ascending aorta diameter.18 Stroke work (SW) per 100 g LV mass was estimated as SW/LV mass)×100, and stroke work loss (SWL) as SWL=100×MG/(MG+SBP).19
Statistical analysis
Continuous variables are presented as mean±SD, categorical variables as percentages. Continuous variables were compared between three groups using one-way analysis of variance (ANOVA) and Tukey's multiple comparison adjustment for the p values were used. Categorical variables were compared between three groups using Pearson χ² test. To test for difference in the linear trend between groups in paired data, Generalised Linear Model was constructed, including a term for the interaction between the group and the explanatory variable in the model. For some models, quadratic term was also considered to convey a non-linear trend. From the fitted equations for each group, estimates were obtained corresponding to AVA=1, AVAi=0.6 and Vmax=4. A p value <0.05 was considered statistically significant. All analyses were performed using SAS V.9.3 software package (SAS Institute, Inc., Cary, North Carolina, USA).
Results
Total group AS severity assessment
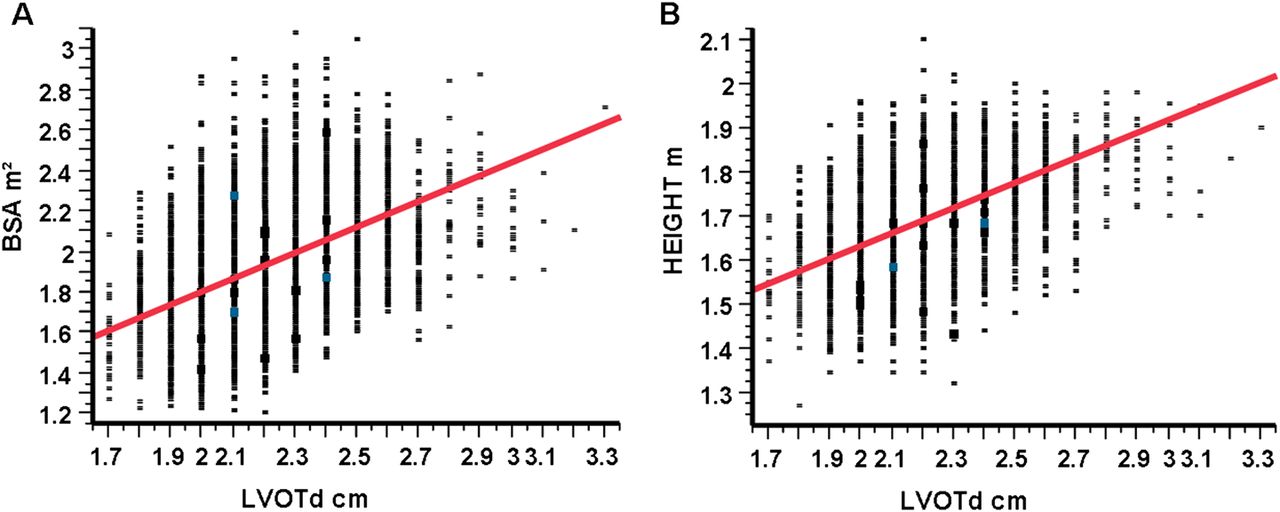
Between 2000 and 2010, there were 15 485 ECGs performed for AS evaluation that met inclusion criteria. Of these, 5195 ECGS were excluded because they were repeat studies on the same patients. Another 630 ECGs were excluded because of inability to generate a TVI-based AVA (missing LVOTd or LVOT-TVI or AV-TVI). An additional 172 patients were excluded due to either LVOTd <1.7 cm, presence of aortic prosthesis, hypertrophic cardiomyopathy or associated congenital heart disease. Thus, a total of 9488 single-patient ECGs constituted our cross-sectional group (table 1), 58% were men, ejection fraction (EF) was 65±6%, and AS severity was compatible with moderate-severe as aggregate; LVOTd 2.18±0.19 cm, LVOT−TVI 24.7±4.8 cm, SVI 48±10 ml/m2, AV−TVI 89±22 cm, AVA 1.09±0.34 cm2, Vmax 3.87±0.75 m/s, MG 36.6±15.6 mm Hg, and TVI−DI 0.29±0.08. For the entire group, there was good correlation between body surface area (BSA) and LVOTd (R=0.48, R2=0.24, p <0.0001, figure 2A). The correlation was slightly better between LVOTd and height (R=0.52, R2=0.27, p <0.0001, figure 2B).
Demographic and echocardiographic characteristics for entire group and by LVOTd

Pearson correlations for BSA-LVOTd (A) and height-left ventricular outflow tract diameter (LVOTd) (B). There was good correlation between BSA and LVOTd (R=0.48, R2=0.24, p<0.0001). The correlation was slightly better between LVOTd and height (R=0.52, R2=0.27, p<0.0001). This figure is only reproduced in colour in the online version.
Total group inconsistent grading by current guidelines
For the entire cross-sectional group (table 1), inconsistent severe-AS by AVA (<1 cm2) with MG ≤40 mm Hg and Vmax ≤4 m/s was seen in 34% (1309 of 3842 with AVA <1 cm2) of patients. In these, the SVI was 41.1±8 ml/m2 vs 46.4±8 ml/m2 in the consistent group (p<0.001). Correcting AVA for BSA (AVAi<0.6 cm2/m2) increased inconsistency to 47% (2482/5311) (p<0.0001).
Inconsistent less-than-severe AS by AVA (≥1 cm2) with MG >40 mm Hg and Vmax >4 m/s was seen in 9% (440/5087) of patients. In these, the SVI was 57.6±11 ml/m2 vs 50.6±10 ml/m2 in the consistent group (p <0.001).
Demographic and haemodynamic descriptors by LVOTd
Clinical and echocardiographic differences between three LVOTd groups are presented in table 1. Most patients (56%) had average LVOTd, but a large LVOTd (35%) was also prevalent. A small LVOTd (9%) was less common. Most patients with small LVOT were women (91%), with higher mean age, higher systolic blood pressure (SBP), higher EF, higher LVH prevalence and higher RVSP (all p<0.001 compared with other groups). This group had the worst systemic haemodynamics; lowest arterial compliance and highest vascular resistance (p<0.001). This is reflected in the high prevalence of high Zva (29%) and low SVI (15%) found in this group (p<0.001 compared with other groups). Conversely, most patients with large LVOTd were men (88%), younger than their small LVOTd women counterparts, with lower SBP, EF and RVSP (all p<0.001). This group had a low prevalence of high Zva (9%) and low SVI (3%). Average LVOTd patients had an even gender distribution with all other descriptors intermediate between small and large LVOTd patients. Although the mean SVI was systematically directly proportional to LVOTd, it did not fall outside the normal values (35–58 ml/m2) for any LVOTd group.
AS severity assessment by LVOTd
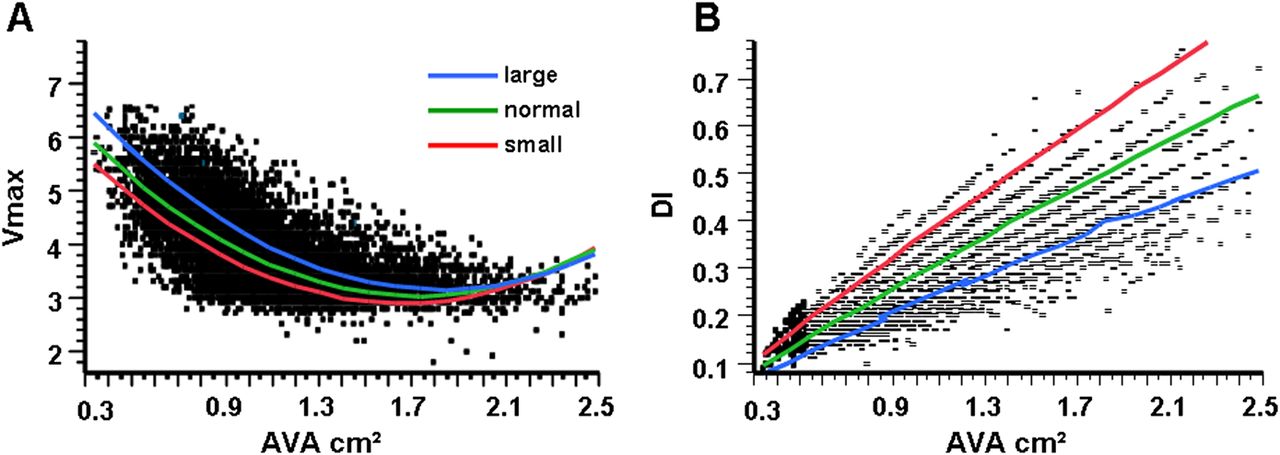
The mean MG (mm Hg) was 36 for large LVOTd, 36.9 for average LVOTd and 37.5 for small LVOTd, for an absolute maximal difference of 1.5 mm Hg, which although statistically significant (table 1), is clinically trivial. Likewise, the mean Vmax (m/s) varied from 3.84 for large LVOTd, to 3.89 for average LVOTd, to 3.92 for small LVOTd, for an absolute maximal difference of 0.08 m/s; statistically significant (table 1) but clinically negligible. In addition, the mean AV−TVI was only statistically different between average and large LVOTd, with a clinically trivial absolute difference of 2 cm. Furthermore, SWL and SW per 100 g of left ventricle (LV) mass were indistinguishable between groups, supporting the notion that the flow-dependent AS severity (Vmax and MG) was not clinically different but similar between groups. Conversely, flow-independent AS severity (AVA and DI) was not only statistically different, but also remarkably clinically different between groups (figure 3A, table 1), as the mean AVA (cm2) was 0.88 (compatible with severe AS) for small LVOTd patients, 1.03 (compatible with moderate-severe AS) for average LVOTd patients, and 1.25 (compatible with moderate AS) for large LVOTd patients. Flow-independent severity was more homogeneous when utilising AVAi, with small and average LVOTd patients falling in the severe AS range and large LVOTd patients in the moderate-severe range (table 1). ELI demonstrated significant differences which, as expected, were directly proportional to AVA, with only the small LVOTd group approaching a clinically proven prognostic cut-off.18 Conversely, only the large LVOTd group approached the significant severity cut-off of 0.25 for DI. In addition, DI values were remarkably different depending on LVOTd (figure 3B), and after adjusting for SV, MG and AVA in the regression model, LVOT remained independently associated with DI, p <0.0001.

(A) Aortic valve area (AVA) against peak aortic velocity (Vmax) shows significant variation between left ventricular outflow tract diameter (LVOTd) groups (All p<0.0001). (B) AVA against dimensionless index shows significant variation between LVOTd groups (all p<0.0001) which are opposite to variations depicted in (A). This figure is only reproduced in colour in the online version.
Patients with severe AS, consistent and inconsistent
Table 1 stratifies important variables by consistent severe AS (C) and inconsistent severe AS (I). Inconsistent severe AS affects the oldest patients of each LVOTd group (mean age 79 years). Inconsistent severe AS patients have the lowest BSA and LVOTd, as well as the lowest LVOTTVI. This is reflected on the cardiac index, which is consistently <3.0 l/min/m2 (mean value) in all inconsistent severe AS groups. However, a low SVI (SVI ≤35 ml/m2) is evident in only 20–23% of groups, and Zva ≥4.5 is present in 27–30% of groups, leaving at least 70% of inconsistent severe AS unexplained by a low SVI/high Zva (paradoxical low flow). Vmax, MG and SWL are all significantly higher in consistent severe AS patients, and lower in inconsistent ones, however, AVA and AVAi classify all groups as severe AS by current guidelines.
Severity parameter correlations by LVOTd
Table 2 shows parameter comparisons by LVOTd groups. For patients with large LVOTd, an AVA of 1 cm2 corresponded to a MG of 42 mm Hg, Vmax of 4.1 m/s and DI of 0.22, all compatible with current guidelines. For small LVOTd patients, an AVA of 1 corresponded to a MG of 29, Vmax of 3.5 and DI of 0.36. Average LVOTd patients displayed intermediate values, with an AVA of 1 corresponding to a MG of 35, Vmax of 3.8 and DI of 0.29. An AVAi cut-off of 0.6 cm2/m2 corresponded to Vmax <4 m/s in all groups (table 2), however, an AVAi cut-off of 0.5 cm2/m2 is associated with a Vmax of 4 m/s for small and average LVOTd patients. Between flow-dependent parameters, there was equivalence across all LVOTd groups: Vmax 3=MG 21, Vmax 3.6=MG 30, Vmax 4.1=MG 40, Vmax 4.6=MG 50 and Vmax 5=MG 59.
Least square mean comparisons among LVOT groups at given cut-offs
Inconsistent grading by LVOTd based on current guidelines
Inconsistencies in AS severity according to LVOTd are depicted in tables 3⇓–5. Inconsistent severe AS by AVA (<1 cm2) with MG ≤40 mm Hg and Vmax ≤4 m/s was seen in 48% of patients with small LVOTd, 37% with average LVOTd and only 16% with large LVOTd (all p <0.0001). All inconsistent severe AS groups had a significantly lower SVI than consistent ones, however, inconsistencies could be explained by paradoxical low flow (SVI ≤35 ml/m2) in only 20–23% of patients, with persistent high inconsistency after elimination of patients with SVI ≤35 ml/m2 for small and average LVOTd groups (tables 3 and 4). Use of AVAi (<0.6 cm2/m2) increased severe AS inconsistency to 49% (272/558) (p=0.9), 48% (1549/3204) (p<0.0001) and 43% (661/1549) (p <0.0001) for small, average and large LVOTd, respectively. Inconsistent less-than-severe AS was <15% for all groups under current guidelines and could be explained by high flow (SVI ≥58 ml/m2) in 42 to 57% of patients.
Consistency analysis for small LVOTd 1.7–1.9 cm (mean 1.87±0.05)
Consistency analysis for average LVOTd 2.0–2.2 cm (mean 2.11±0.08)
Consistency analysis for large LVOTd ≥2.3 cm (mean 2.40±0.13)
Inconsistent grading by LVOTd based on different hypothetical AVA cut-offs
Small LVOTd group
When inconsistencies were analysed using AVA cut-off of 0.9 cm2, inconsistent severe AS for patients with small LVOTd was reduced to 38% (table 3) with a small absolute increase in consistent less-than-severe AS patients (table 3, figure 4A), and a small increase in inconsistent less-than-severe AS from 3% to 5%. Inconsistent severe AS decreased further in small LVOTd patients to 26% when using an AVA cut-off of 0.8 cm2 (table 3), with a small increase in inconsistent less-than-severe AS to 8% and an absolute increase in consistent less-than-severe AS patients from 268 to 447 patients (table 3, figure 4A). Of these 447 patients, 31 (7%) had SVI ≤35 ml/m2 and their AVA was 0.94±0.09 cm2 compared with 1.1±0.21 cm2 for the rest of the consistent less-than-severe group (p <0.0001), thus, a small proportion of paradoxical low-flow patients with AVA between 0.8 and 1 cm2 were reassigned to consistent less-than-severe AS. An AVA cut-off of 0.9 cm2 corresponded to a Vmax of 3.7 m/s and 0.8 cm2 to a Vmax of 4.0 m/s for the small LVOTd group.

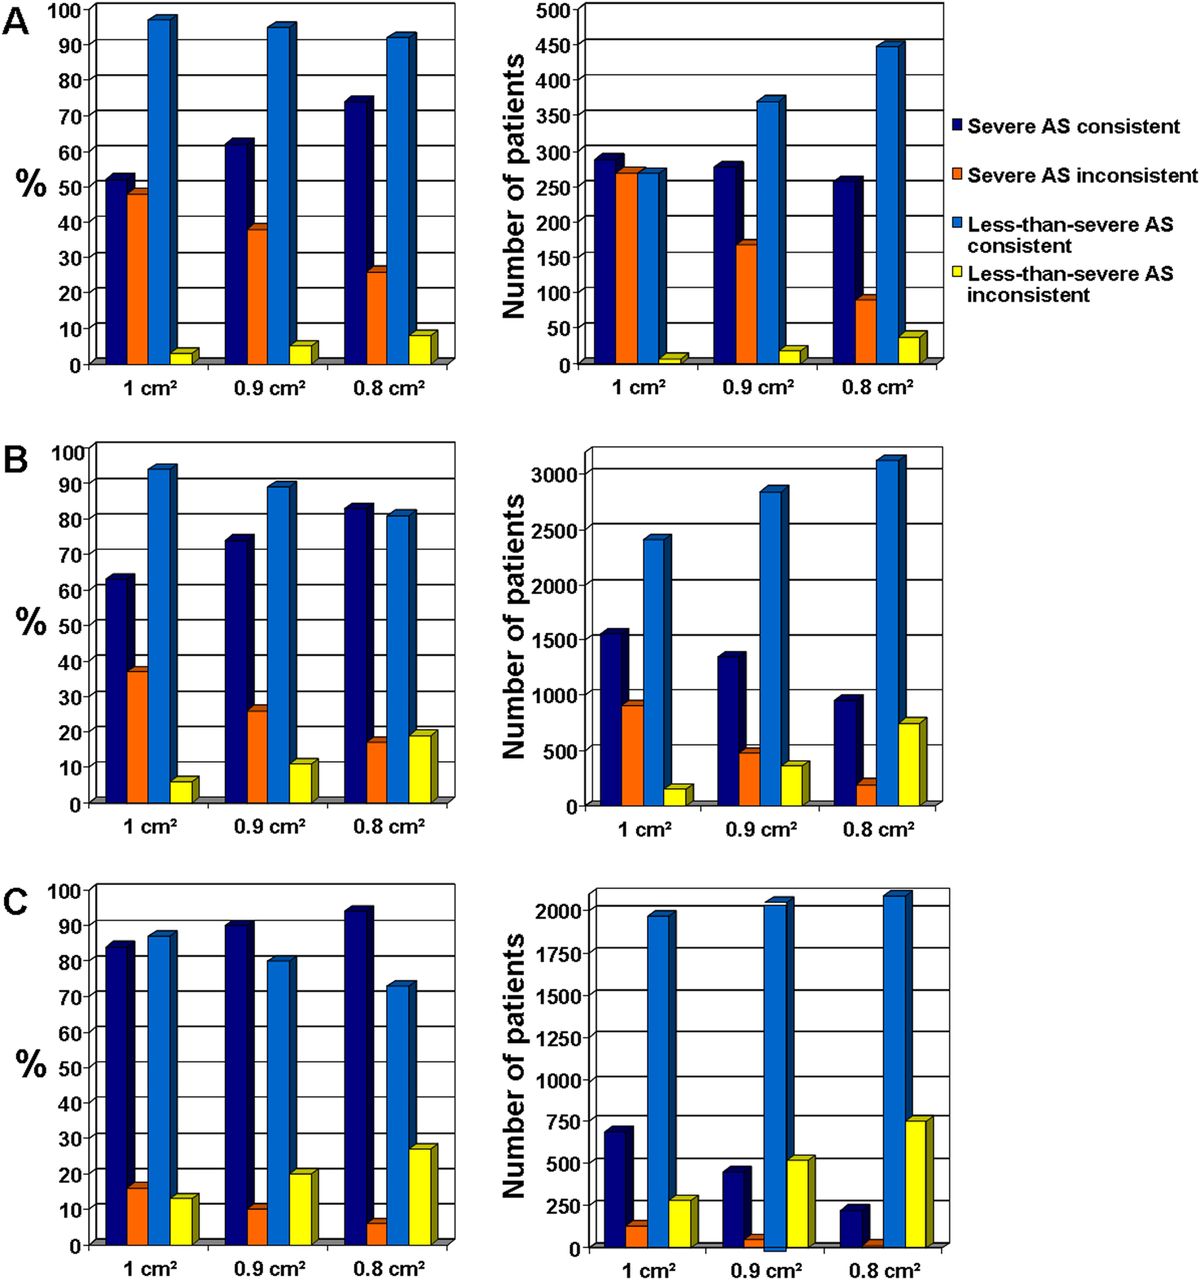
Bar graphs on the left show the percentage (%) of patients allocated to each aortic stenosis (AS) severity group (y-axis) according to different AVA cut-offs (x-axis). Bar graphs on the right depict the absolute number of patients assigned to each AS severity group (y-axis) according to different AVA cut-offs (x-axis). (A) Corresponds to small left ventricular outflow tract diameter (LVOTd) patients: A cut-off of 0.8 cm2 significantly increases relative severe-AS consistency and decreases relative severe-AS inconsistency (left graph), with a small decrease in absolute consistent severe-AS patients (right graph) and a small absolute increase in less-than-severe inconsistent AS patients (right graph). (B) Corresponds to normal LVOTd patients: A cut-off of 0.9 cm2 significantly increases relative severe-AS consistency and decreases relative severe-AS inconsistency (left graph), with a small decrease in absolute consistent severe-AS patients (right graph) and a small absolute increase in less-than-severe inconsistent AS patients (right graph). However, a cut-off of 0.8 cm2, despite significantly increasing relative severe-AS consistency (left graph), significantly deceases absolute severe-AS consistency at the expense of increasing less-than-severe inconsistent patients (right graph), decreasing sensitivity in severe AS diagnosis. (C) Corresponds to large LVOTd patients: A cut-off of 1 cm2 represents the best relative AS severity patient allocation (left graph) with the highest absolute severe-AS consistency (right graph) and lowest absolute less-than-severe inconsistency (right graph). Cut-offs less than 1 cm2 significantly decrease the absolute number of patients with consistent severe AS and increase the absolute number of less-than-severe inconsistent AS patients, jeopardising sensitivity in severe AS diagnosis. Note the similar relative patient distribution between small LVOTd at 0.8 cm2, normal LVOTd at 0.9 cm2 and large LVOTd at 1 cm2 (left graphs). Note the similar absolute patient-number distribution between small LVOTd at 0.8 cm2, normal LVOTd at 0.9 cm2 and large LVOTd at 1 cm2 (right graphs). This figure is only reproduced in colour in the online version.
Average LVOTd group
For average LVOTd patients, inconsistent severe AS was reduced to 17% when using AVA cut-off of 0.8 cm2 (table 4), at the expense of increasing inconsistent less-than-severe AS from 6% to 19% (figure 4B). An AVA cut-off of 0.9 cm2 reduced inconsistent severe AS to 26% (table 4), increasing inconsistent less-than-severe AS from 6% to 11%, and increasing consistent less-than-severe AS patients from 2409 to 2844 (table 4, figure 4B). Of these 2844, 170 (6%) had SVI ≤35 ml/m2 (table 4) and their AVA was 1.07±0.14 cm2 compared with 1.24±0.24 cm2 for the rest of the consistent less-than-severe (p <0.0001), such that a small number of patients with paradoxical low-flow and AVA <1 cm2 were reassigned to consistent less-than-severe. For average LVOTd patients, an AVA of 0.9 cm2 corresponded to a Vmax of 4.0 m/s and 0.8 cm2 to a Vmax of 4.3 m/s.
Large LVOTd group
Large LVOTd patients decreased their severe AS inconsistency from 16% to 10% and further to 6% when using AVA cut-offs of 0.9 and 0.8 cm2, respectively (table 5), at the expense of more than doubling inconsistent less-than-severe patients at the 0.8 cm2 cut-off (table 5, figure 4C).
Discussion
To our knowledge, this study characterises, for the first time, LVOTd variability in the AS population and its influence on echocardiographic AS severity assessment, within the largest cross-sectional contemporary group of AS patients assembled for inconsistency evaluation. Our study shows over one half of AS patients having an ‘average’ LVOTd, more than one-third having a large LVOTd and a small LVOTd present in a minority of patients. We found striking LVOTd-related discrepancies in flow-independent AS severity parameters such that universal AVA and DI severity cut-offs are likely not fitting for all AS patients. We find that current severe AS guidelines are most consistent for large LVOTd patients, hence, the low inconsistency grades were found for both severe and less-than-severe AS. Conversely, 48% of small LVOTd patients and 37% of average LVOTd have inconsistent severe AS. Notably, the proportion of inconsistent severe AS remains high for both small and average LVOTd patients after excluding potential paradoxical low-flow patients (SVI ≤35 ml/m2), suggesting the LVOTd as the likely culprit for the persistent discrepancy (tables 3 and 4). Conversely, the largest proportion of inconsistent less-than-severe AS is seen in large LVOTd patients under current guidelines, and excluding high-flow patients (SVI ≥58 ml/m2) does not resolve the inconsistency (table 5), again evidencing the influence of the LVOTd. Our observed severe AS inconsistency for the entire cross-sectional group (34%) corroborates the observation made by Minners et al6 In addition, our findings demonstrate that the known correlation between flow-dependent parameters6 is independent of the LVOTd.
What is severe AS?
To be clinically meaningful, ‘severe AS’ must be derived from an accurate haemodynamic assessment that combines several flow-dependent and flow-independent parameters which have reached thresholds proven to be associated with adverse clinical consequences that oblige cautious interval follow-up or intervention. In AS, few studies have validated the prognostic significance of severity parameters; a Vmax >4.0–4.5 m/s has been associated with significant risk of cardiac events within 2 years,20–22 and thus, has been appropriately adopted as a severity cut-off. Our study shows that the correlation between this Vmax cut-off and a MG of 40–45 mm Hg is independent of the LVOTd. Interestingly however, our study and those of others6 ,23 reveal that current Vmax and MG cut-offs correspond to an AVA less than 1 cm2. However, our study shows that this discrepancy significantly affects small and average LVOTd groups, but not large LVOTd patients.
Few studies have addressed the prognostic value of the AVA; Pai et al24 found an AVA of ≤0.8 cm2 indicative of poor prognosis without aortic valve replacement, even in asymptomatic patients. More recently, our group25 studied the prognostic value of severe AS parameters and found that AVA <1 cm2 and AVAi <0.6 cm2/m2 were the strongest predictors of outcome, irrespective of MG and Vmax. Interestingly however, the 96 patients with an AVA <1 cm2 in that study had a mean AVA closer to 0.8 cm2 (0.79±0.14 cm2) and 73% of them had AVA <0.9 cm2. Therefore, an AVA <1cm2 is likely a highly sensitive cut-off, but lacks specificity, as partially evidenced by the high severe AS discordance rate of 63% found in that study.25 The same applies to an AVAi of <0.6 cm2/m2, which classified all patients with inconsistent severe AS in the current study as severe AS (table 1), with a significant increase in severe AS inconsistency in the average and large LVOTd groups, reflecting the overweight nature of our study group and exposing a natural limitation of the AVAi in US patients (mean body mass index was 29±8 Kg/m2 for the entire group). Therefore, for current guidelines, the use of AVAi appears to be passable for patients with small body size, or small LVOT, to aid in determining if a small AVA with low MG represents moderate AS (AVAi >0.6), and adequate for patients with large body size, or large LVOT, to aid in determining if an AVA slightly greater than 1 cm2 with high MG represents severe AS (AVAi <0.6). However, our study suggests that a AVAi cut-off of 0.5 cm2/m2 may be a more meaningful partition coefficient for a wider range of patients since it is associated with a Vmax of 4 m/s for small and average LVOTd (table 2) and correlates with a MG of 36, 38 and 41 mm Hg for small, average and large LVOTd, respectively (vs 29, 31 and 33 mm Hg for AVAi of 0.6, table 2).
Paradoxical low flow severe AS
The existence of paradoxical low-flow (SVI ≤35 ml/m2) regardless of a normal EF in AS patients is well recognised and associated with poor outcomes when the AVA is <1 cm2 as shown by Hachicha et al.16 Interestingly, like in our study, older women with smaller LVOTd were common in Hachicha's paradoxical low-flow group, which could suggest that the small LVOTd is responsible for the abnormally low SVI. It is more likely however, that a small LVOTd is a demographic indicator of the potential presence of paradoxical low-flow and not its direct cause, because the volumetric (Simpson method) SV was also significantly lower in the paradoxical low-flow patients in the study by Hachicha et al.16 As shown, hypothetical cut-offs of 0.8 cm2 and 0.9 cm2 to define severe AS in patients with small and average LVOTd patients, respectively, would considerably decrease severe AS inconsistency without significantly increasing the proportion of paradoxical low-flow patients reassigned to the consistent less-than-severe category. However, as demonstrated, a proportion of these low-flow patients reassigned to the consistent less-than-severe AS group would still have an AVA <1 cm2, and despite a mean AVA closer to 0.8 cm2 (0.76) in the paradoxical low-flow patients of Hachicha et al, their standard deviation of 0.23 cm2 suggests that there were patients between 0.9 and 1 cm2 in the low-flow group. Therefore, suggesting lower AVA cut-offs for paradoxical low-flow AS could hazardously decrease the sensitivity to identify this high-risk group, rendering the hypothetical AVA thresholds tested in the current study of potential use exclusively for patients with normal flow. Therefore, for patients undergoing AS severity evaluation, besides adhering to high technical standards3 ,11 for accurate LVOTd measurements, we believe that reporting the SVI, and whether it represents normal or low flow, should be a priority. If paradoxical low-flow is identified, an AVA <1 cm2 (independently of the LVOTd) likely represents significant low-flow AS regardless of MG <40 mm Hg and Vmax <4 m/s and should be evaluated further.26
Hypothetical aortic valve area thresholds for patients with normal flow
Patients with a small LVOTd likely represent a higher-risk group because of the demographic characteristics described, but also because this group is likely to be at risk of patient-prosthesis mismatch after aortic valve replacement, which is associated with worse postoperative outcome.27 Therefore, increasing consistency and specificity in severe AS diagnosis may be important for this group. An AVA cut-off of ≤0.8 cm2 for small LVOTd patients with normal EF and normal flow could achieve this without significantly increasing patient reassignment to inconsistent less-than-severe AS (figure 4A). For average LVOTd patients with normal EF and normal flow, an AVA cut-off of ≤0.9 cm2 increases consistency without a significant increase in inconsistent less-than-severe AS patient reassignment (figure 4B). Alternatively, a single cut-off of 0.85 cm2 could be valuable and less cumbersome for both small and average LVOTd patients. In addition, for small and average LVOTd patients, our study suggests that an AVAi cut-off of 0.5 cm2/m2 has a better correlation with Vmax of 4 m/s. Conversely, for large LVOTd patients with normal EF and normal flow, a severe AS AVA cut-off of ≤1 cm2 (compatible with current guidelines) displays good consistency. Adopting a severe AS AVA cut-off of 0.8 or 0.9 cm2 would dangerously decrease sensitivity for severe AS diagnosis for this group (figure 4C). An AVAi <0.6 cm2/m2 is likely a useful tool to further increase sensitivity for severe AS in this group, particularly if the patient is not obese.
Importantly, although we have used clinically validated echocardiographic thresholds (ie, Vmax) in the interpretation of our results, and evaluated the AS severity reassignment consequences of using different AVA cut-offs in light of those clinically significant thresholds, clinical outcomes validation of different AVA cut-offs according to LVOTd or patient size has not been performed, and our tested thresholds remain hypothetical. Nevertheless, the LVOT-related inconsistencies are striking and should be explored in future outcomes research if our goal is to individualise AS severity grading.
The dimensionless index
A remarkable finding of our study is the variation in DI by LVOTd groups, which unswervingly challenges the current recommendation of relying on the DI when the LVOTd cannot be measured.4 From a mathematical perspective, AVA=LVOTd2×0.785×DI; where LVOTd is independent because there is only one for each individual, and the LVOT-TVI varies according the continuity principle and flow state, while the AV-TVI is dependent on flow state and AS severity. When utilising an LVOTd of 1.8 cm and a ‘severe’ DI of 0.25, the AVA calculates 0.64 cm2, but when the LVOT is 2.5 cm and DI is 0.25, the AVA doubles to 1.2 cm2. Table 2 shows that in real patients, an AVA of 1 cm2 corresponds to DIs of 0.36, 0.29 and 0.22 for small, average and large LVOTd patients, respectively. When using more fitting severe AS AVA cut-offs, DI approaches 0.25; a DI of 0.29 corresponds to an AVA of 0.8 cm2 for small LVOTd patients, and a DI of 0.26 corresponds to an AVA of 0.9 cm2 for average LVOTd patients.
The DI cut-off for severe AS ought to be modified according to the LVOTd, and if the severe-AS AVA cut-off remains 1 cm2 on future guidelines, DI severe AS cut-offs should be approximately ≤0.35, ≤0.3 and ≤0.25 for small, average and large LVOTd patients, respectively. The recommendation of relying on DI when LVOTd is not measurable ought to be eliminated. In these cases, given the good correlation between LVOTd and height (figure 2), a size-adjusted LVOTd reference value can provide an approximation to the AVA.28
Limitations
Paradoxical low flow, body size, haemodynamic state, measurement errors and possibly unknown factors, are all potential contributors to inconsistencies in echocardiographic AS grading; therefore, the sole consideration of LVOT cannot completely resolve such a complex issue. Nevertheless, for the first time, we show striking LVOTd-related discrepancies in flow-independent AS severity parameters such that universal AVA and DI severity cut-offs are likely not fitting for all AS patients. The limitation of the least-square method, or linear regression method is that we cannot control for all correlated predictors. We have focused our attention on the LVOT which is independent of flow and AS severity, and is the most influential variable of the continuity equation. Including the LVOTd as a variable in a linear multiple regression model might be a way of controlling for other variables, but it would be less specific because it would not allow comparison of correlation estimates between three groups.
Due to time constraints, LVOTd-derived SVI agreement with volumetric methods was not evaluated, however, our measurements were based on high-quality LVOTd and Doppler SVI measurements. Our method of LVOTd diameter measurement differs from the current recommendation of measuring 5–10 mm below the aortic cusps3 and could, theoretically, lead to error (overestimation) in SV calculation, however, our method has been validated against catheterisation29 ,30 and used in most studies examining the prognostic significance of echocardiographic quantification in AS. In our study, ascending aorta diameters were measured at end diastole, or at its widest dimension, were best visualised regardless of the cardiac cycle; using the diastolic measure may overestimate the magnitude of pressure recovery and, thus, underestimate the stenosis severity as estimated by ELI. The presence of a sigmoid septum in patients with a small LVOT could, theoretically, lead to overestimation of the SV (which would tend to reduce severe AS inconsistency), however, despite this potential limitation, the frequency of severe AS inconsistent grading remains striking in our patients.
Finally, the large number of patients evaluated renders a few parameter comparisons statistically significant when they are clinically insignificant. For instance, the mean heart rate between LVOTd groups is no different between groups by any standard except statistically. Likewise, LVOTd group differences between MG and Vmax are clinically inconsequential since they do not allocate a patient into a different AS severity group.
Conclusion
The LVOTd is associated with significant discrepancies in echocardiographic AS assessment by current guidelines. For patients with normal EF and normal flow, current guideline definition of severe AS is most accurate for patients with large LVOTd, but not so for patients with average or small LVOTd in whom lower AVA cut-offs could potentially improve consistency without significantly decreasing sensitivity. Outcomes studies are needed to verify the clinical applicability of these thresholds. The DI is highly variable, depending on the LVOTd, and guidelines should redefine this parameter according to the LVOTd. These insights may confer more individualisation capability to the echocardiographic AS severity grading process.
Acknowledgments
The authors wish to thank Stephen Cha, Master Level III Biostatistician, Division of Biomedical Statistics and Informatics, Mayo Clinic, Rochester, Minnesota, USA, for his critical contribution is statistical analysis of the data.
References
Footnotes
-
EM and HIM have contributed equally.
-
Contributors All authors contributed to the design, data collection, analysis, drafting and revision of the manuscript. HIM and EM have had full access to all the data in the study, and we take full responsibility for the integrity of the data and the accuracy of the data analysis.
-
Competing interests None.
-
Ethics approval IRB.
-
Provenance and peer review Not commissioned; externally peer reviewed.