Article Text

Statistics from Altmetric.com
Recent developments in hardware and software have increased the diagnostic capabilities of magnetic resonance imaging (MRI) and electron beam computed tomography (EBT) to visualise the cardiac anatomy, including the coronary arteries. Visualisation of the heart puts any diagnostic technique to the test, because the continuous cardiac motion distorts the image and high temporal resolution is required to “freeze” the heart to produce a sharp image.
In particular, non-invasive visualisation of the coronary arteries is difficult because of the small size of the coronary arteries (2–5 mm in diameter), the complex, tortuous course making it often impossible to “catch” the coronary artery in one slice (tomogram), and the cardiac and respiratory motion causing loss of sharpness or motion artefacts.
In this article image acquisition and processing techniques of MRI and EBT will be presented. The clinical role of both techniques in cardiac imaging will be discussed, together with a brief introduction of the technical aspects.
Magnetic resonance imaging: physics and technique
MRI has excellent temporal and spatial resolution and is capable of visualising the cardiac anatomy. The advantages of MRI are its ability to acquire images non-invasively, in the absence of ionising radiation, and in any tomographic plane without interference from surrounding bone or soft tissues. The basic concepts and clinical role of MRI can be found in excellent recent review articles.1-5 In this paper we limit ourselves to a brief summary of MRI concepts.
MRI scanner
The MRI scanner consists of a magnet, gradient coils, and a body coil. The large magnet produces a strong homogeneous magnetic field, is cylindrical, and for imaging the patient is placed within the bore of the magnet. Gradient coils vary the strength of the magnetic field from one point to another and they determine the spatial information of the emitted MR signal necessary for the construction of the image. The bodycoil acts as an antenna, and transmits and receives radiofrequency (RF) waves.
Basic principles of MRI
Nuclei with an odd number of protons (such as hydrogen) posses a property called spin angular momentum—that is, the nucleus spins around its axis. Since the odd nuclei are positively charged, the spinning motion causes a magnetic momentum around it and acts as a small magnet. The strength of this magnetic moment is a property of the type of nucleus. Hydrogen nuclei possess a large magnetic moment, and are very abundant in the human body thereby making hydrogen the nucleus of choice for MRI. In the absence of an externally applied magnetic field (Bo) these individual magnetic moments have no preferred orientation, but when placed in strong external magnetic field these magnetic moments align with the orientation of the external field. However, the spins do not exactly align but are at an angle to the external magnetic field (fig 1). This causes the spin to precess around the axis of the external magnetic field with a unique (resonant) frequency.
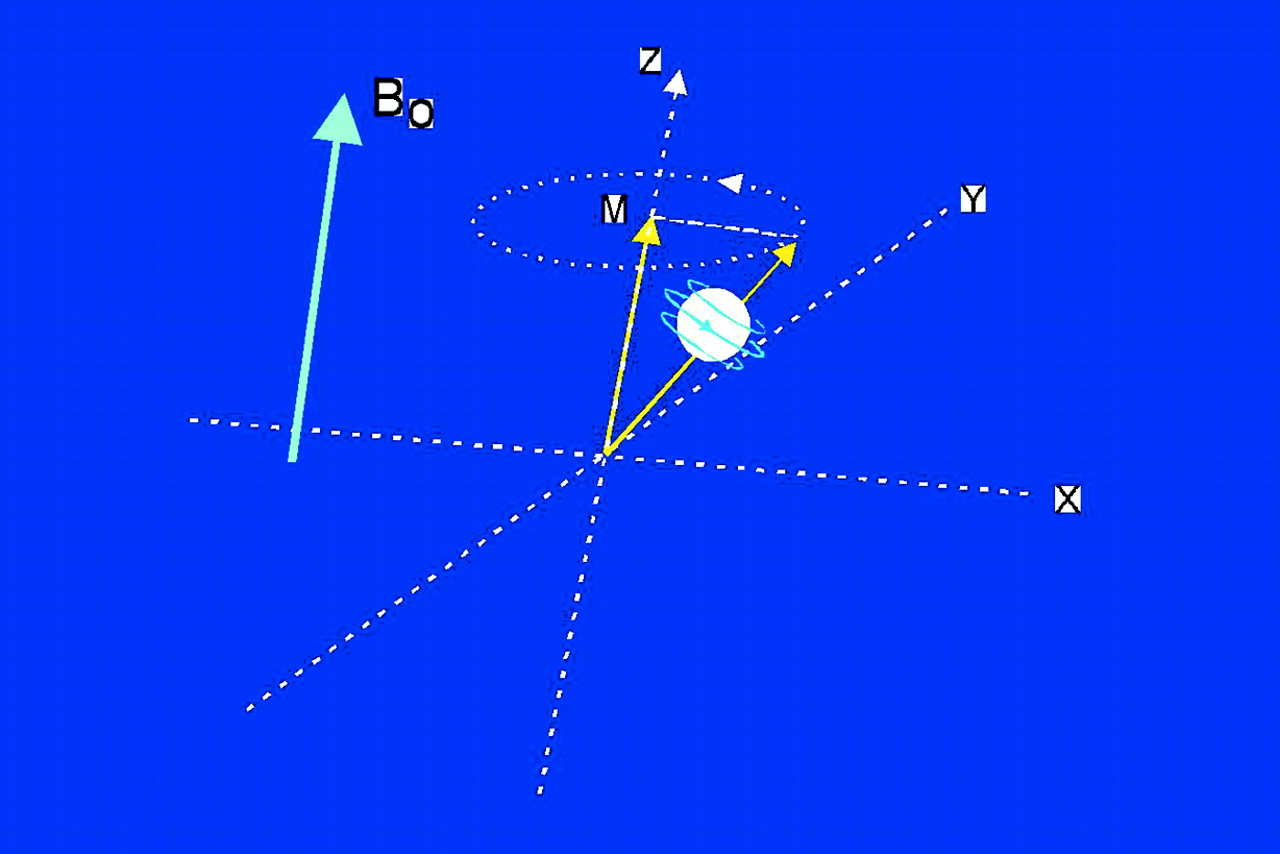
Spin angular moment causing a magnetic dipole. Bo, external magnetic field which causes spin to precess at an angle to Bo. M, net tissue magnetisation aligned along Z axis.
The unique frequency of this precession is governed by the Larmor frequency equation f = g × M, where f = frequency, g = gyromagnetic ratio (unique for each nucleus), and M = strength of magnetic field. The spins precess at random and give rise to a rather small secondary magnetic field (net tissue magnetisation, M) which at equilibrium is aligned longitudinally, along the axis of the main magnetic field (Bo) which is much larger, so that tissue magnetisation is “overruled” by the main magnetic field Bo, making tissue magnetisation undetectable in the longitudinal axis. To “detect” this tissue magnetisation to produce an MR image it is necessary to disturb this equilibrium. An RF pulse emitted from the RF transmitter coil with a resonant frequency equal to the unique frequency of the precessing spins rotates the net longitudinal tissue magnetisation into the transverse plane (X-Y plane) and synchronises the precession (fig 2). This allows the transverse magnetisation to be detected and measured. Termination of the RF pulse causes the perturbed nuclei to return (relax) to the original longitudinal alignment in the magnetic field and incoherent precession. As they relax a signal is emitted which is detected by the RF receiver. This is the MR signal from which the image is reconstructed.

The patient (heart) is placed within a strong external magnetic field (Bo). The RF transmitter rotates the net tissue magnetisation in the transverse plane, and after termination, relaxation occurs which emits a signal detected by the RF receiver. The gradient coils produce a supplemental magnetic field gradient to allow precise location of the excited protons. The received signals have certain signal intensity (brightness) and location, both of which are processed to form the desired image.
Different tissues relax at different rates, thus providing contrast between tissues. This signal needs to be processed to allow three dimensional location of the source (tissue protons) of the signal. A supplemental magnetic field gradient is applied (by the gradient coils) which causes a predictable variation of the magnetic field and thus a predictable resonant frequency of protons along an axis. This allows exact location of protons enabling precise image reconstruction.
Cardiac MRI
MR coronary imaging: technique
Cardiac and respiratory motion are formidable problems making robust MR coronary angiography very difficult. Today conventional diagnostic coronary angiography is the undisputed standard of reference because a selective injection of contrast media reproduces in real time (no motion artefacts) the entire coronary artery (including collaterals), with an in-plane resolution of 0.15 × 0.15 mm.
Coronary imaging with an image acquisition of 25–50 images per second (that is, 20–40 ms per acquisition), such as can be achieved with conventional diagnostic coronary angiography, would result in a nearly motion free image, but unfortunately such ultrafast MR acquisition techniques are not yet available. To circumvent these motion problems several other approaches must be used. To reduce cardiac motion disturbances one chooses a “quiet” window in the cardiac cycle during which the heart does not contract. This window is usually in mid and late diastole and lasts for about 100 ms to 150 ms. This window can be selected by triggering to the ECG signal so that the acquisition is performed in that predetermined window. This requires a stable heart rhythm and precludes patients with arrhythmias.
Respiratory motion artefacts can be reduced by using two acquisition approaches: (a) breathholding, and (b) respiratory gating. Breathholding for 20 seconds is possible in the majority of patients.
Respiratory gating techniques make use of a navigator technique, which monitors the movement of the diaphragm during respiration so that images are acquired only at the same predetermined diaphragm level. Potential navigator techniques allow longer acquisition times, during normal breathing, but irregularities in breathing pattern during long acquisition periods “shift” the diaphragm level, which may be (partly) overcome by adaptive windowing (to correct for diaphragm shift).
Another problem is the presence of epicardial fat, which produces a bright MR signal, which may interfere with the signal of blood within the coronary arteries. Fat saturation—that is, a strong RF pulse that selectively saturates the magnetisation of fat bound hydrogen atoms, but not waterbound hydrogen atoms—effectively suppresses this fat signal and is often used in MR coronary imaging.
MR coronary imaging to detect a coronary stenosis
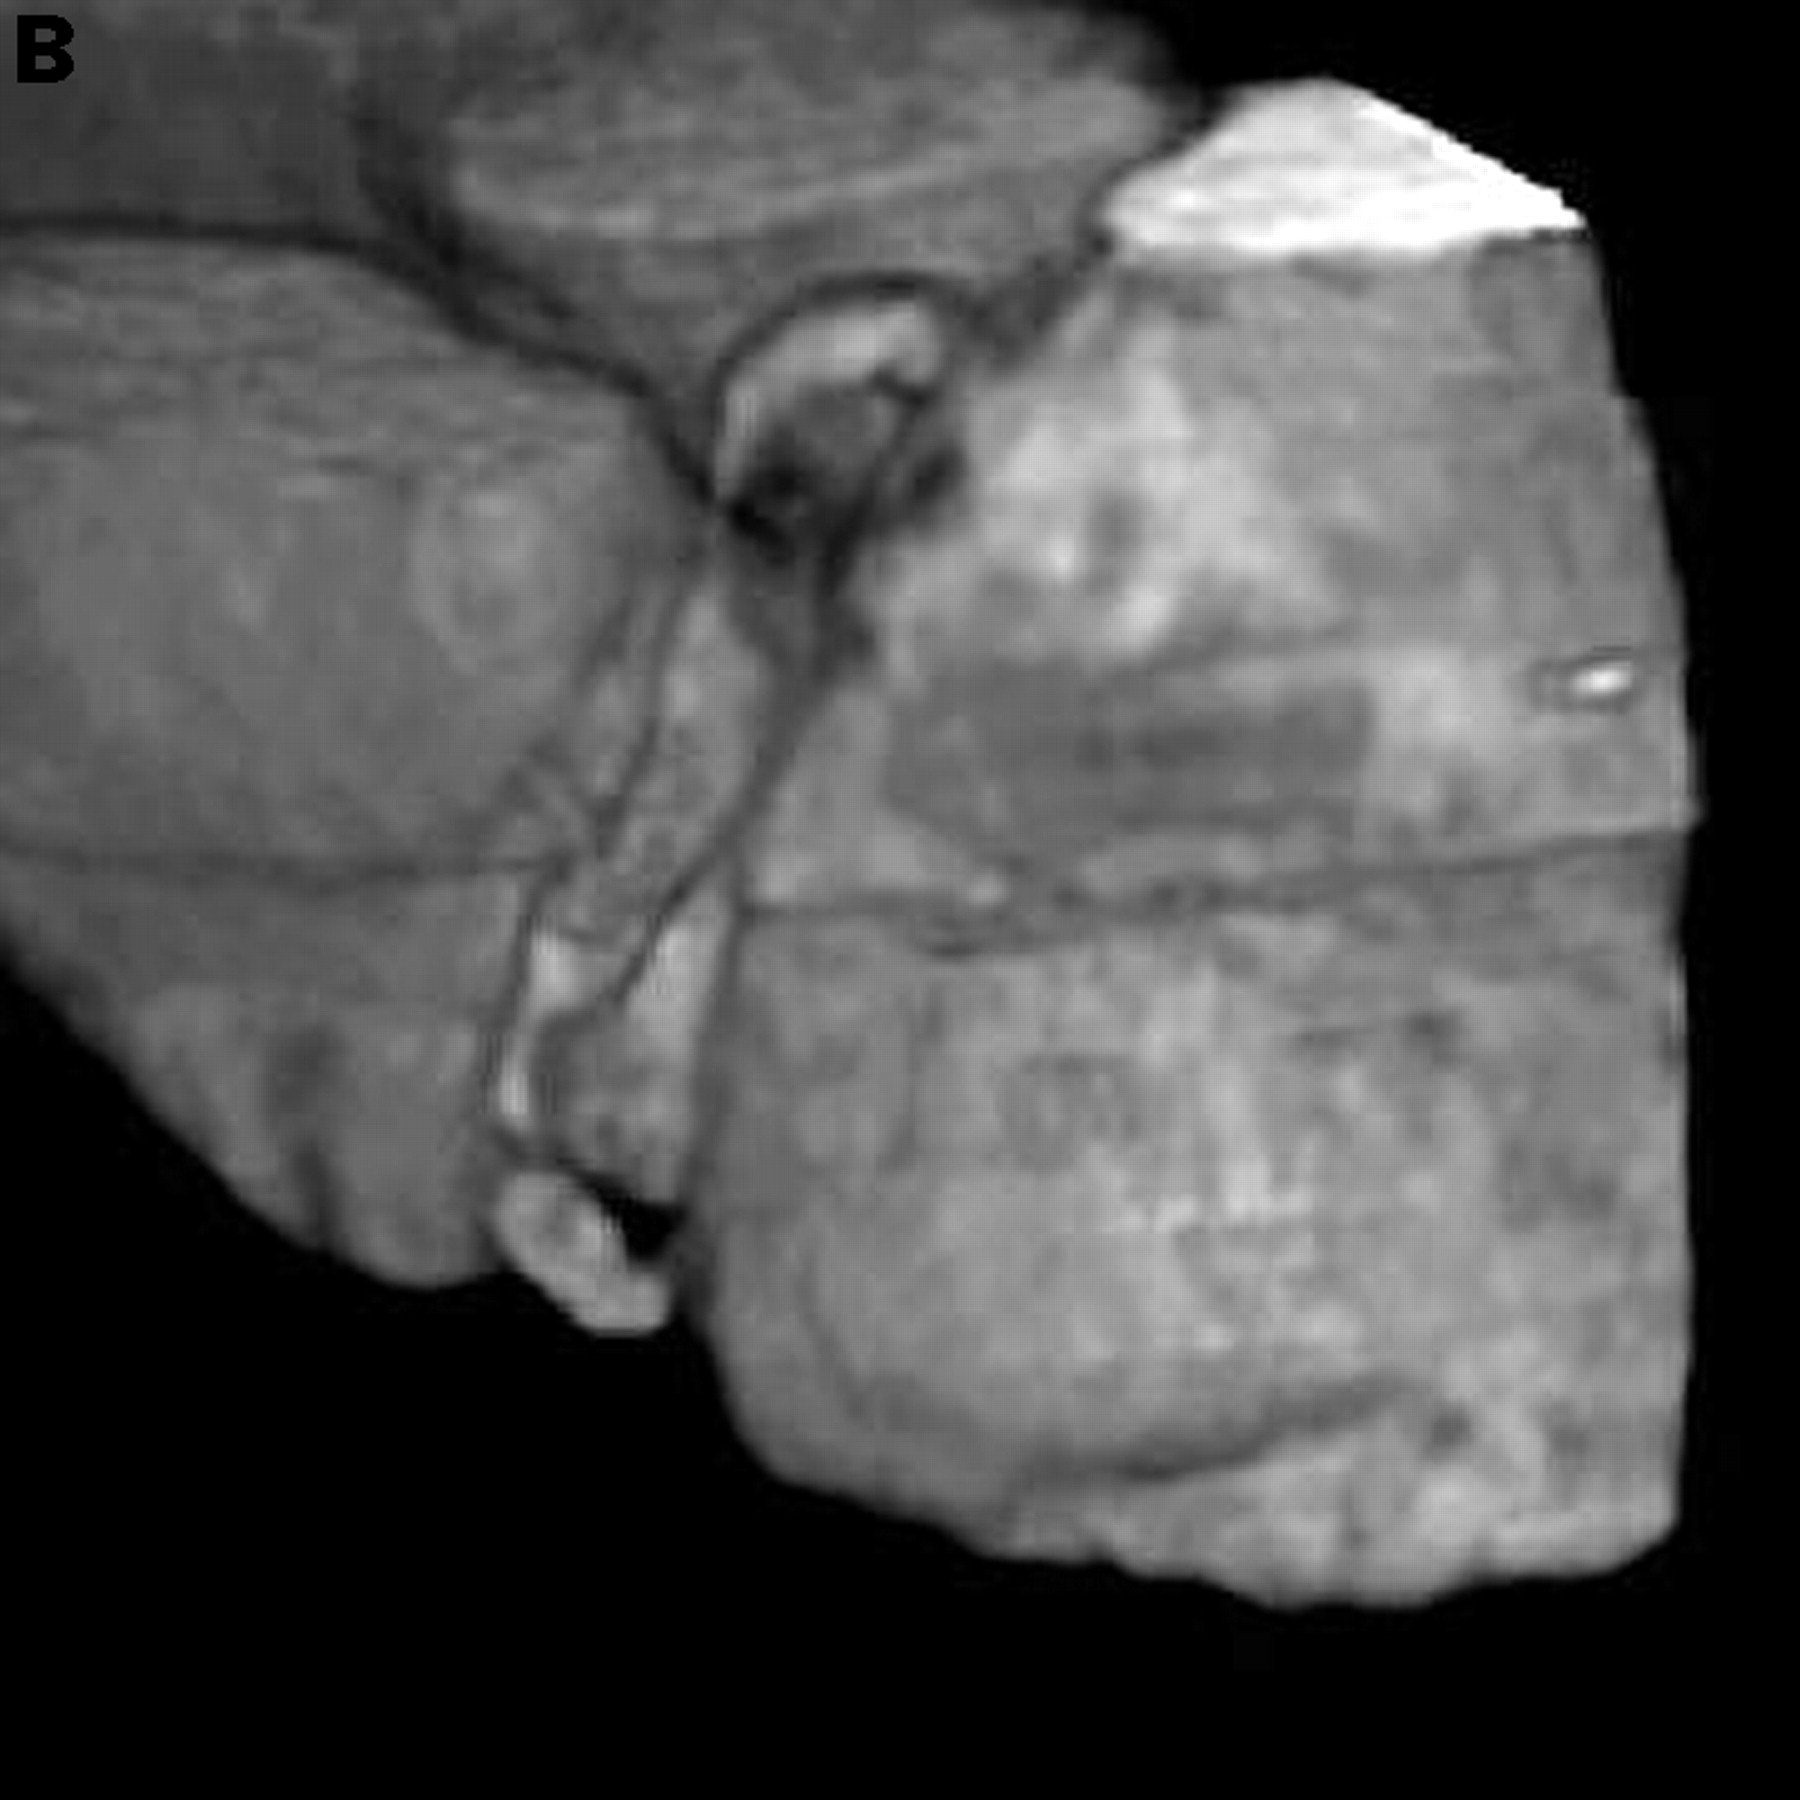
The detection of haemodynamically significant lesions with different MR techniques appears to be the “Holy Grail” of MR imaging (fig 3). So far, the results of detecting stenoses have been disappointing with sensitivities ranging from as low as 33% to as high as 90%.1 ,2 ,6 Overall the MR techniques are not robust enough to allow clinically reliable identification of a coronary lesion. The inability to reliably detect coronary stenosis is caused by: (1) the unacceptable quality of the images (mainly caused by problems of cardiac and respiratory motion) which makes interpretation unreliable or sometimes even impossible; (2) partial voluming of tortuous vessels; (3) intravoxel phase dispersion caused by complex or turbulent flow at coronary stenosis; (4) overlapping of adjacent anatomic structures, in particular the circumflex artery which is obscured by overlapping of the coronary sinus; (5) an inability to distinguish normal antegrade coronary flow from collateral filling of a vessel occurring beyond a severe stenosis or total occlusion; and (6) MR signal of the vessel wall or coronary plaque mimicking the blood signal of the vessel lumen.


Visualisation of the right coronary artery with (A) a fast sequence MR coronary angiography technique, and (B) three dimensional reconstruction. Two significant stenoses are clearly visible.
Future of MR coronary imaging
There are three factors that must always be considered in MR coronary imaging: acquisition time, signal to noise ratio, and resolution. Improvement of one of the three is at the expense of one or both of the other two, and therefore MR imaging is about trying to find the optimal compromise.
Ultrafast new MR scanners will allow: (a) shorter acquisition windows (less than 100 ms) which may dramatically reduce motion artefacts; and (b) three dimensional acquisition which offers the advantage of higher signal to noise ratio, and more isotropic pixel resolution. Small volume scan acquisition oriented along the coronaries, obtained during one breath hold, is feasible and appears promising.7 The low contrast to noise ratio is expected to be improved by blood pool contrast media, so that the vessel lumen becomes more visible and protruding lesions can be distinguished. High gradient scanners are expected to improve the current spatial resolution of typical sequence of 1.5 × 1.5 × 3 mm to an in-plane resolution of less than 1 mm. However, it may take several years before MR coronary angiography will evolve into a reliable clinical tool.
MR imaging to establish proximal course of coronary arteries
MR imaging is a reliable, patient friendly technique to assess the anomalous origin or proximal abnormal course of the right and left coronary arteries accurately.8
Clinical role of MRI in cardiac disease
Established role—evaluation of atria, ventricles, and pericardium:
congenital heart diseases
cardiac tumours (masses)
pericardial disease
left ventricular volume, mass
left ventricular function: wall thickness/systolic thickening
right ventricular function
Emerging role:
visualisation of coronary arteries
visualisation of bypass grafts
dobutamine stress MRI for coronary ischaemia to detect wall motion, abnormalities or myocardial contractile reserve
Potential role:
epicardial coronary flow velocity (rest/stress)
myocardial perfusion (rest/stress)
specific contrasts for myocardial necrosis or viable tissue
MR imaging of saphenous vein grafts
MR imaging of vein grafts is relatively easy because the grafts have a large diameter (4–8 mm) and are minimally affected by cardiac and respiratory motion. The patency of grafts can be established by MR with a sensitivity of 85–90% and a specificity of 60–100%.1 ,2 However, these examinations only provide information on graft patency and no information about non-occluding stenoses or graft patency of a sequential graft distal to a first coronary anastomosis, thus limiting the application in clinical practice.
MR imaging of right and left ventricle
Newer MR techniques (gradient echo imaging or echo planar imaging) allow acquisition of short axis (or long axis) slices within 50 ms with adequate image quality to assess quantitative evaluation of left ventricular function.4
The use of end diastolic and end systolic measurements allows calculation of stroke volume, ejection fraction, and ventricular mass. Wall motion abnormalities can be evaluated quantitatively by cine MR imaging (fig 4).9 Myocardial tagging allows for detection of very subtle wall motion abnormalities. MRI permits accurate delineation of epicardial and endocardial borders so that wall motion and systolic wall thickening can be analysed quantitatively. Stress MRI (using dobutamine) is emerging as a technique to detect coronary artery disease,10 ,11 and evaluation of myocardial contractile reserve by stress MRI appears useful for evaluating myocardial viability.12 ,13 Myocardial perfusion imaging is emerging as a valuable tool to assess distribution of myocardial perfusion with high resolution.14 ,15 The anatomy and function of the right ventricle in particular is notoriously difficult to assess adequately. However, MR imaging allows evaluation of the right ventricle, which may prove to be useful to monitor congenital heart disease (fig 4).

Computer display of the MASS analytical software package. The small images along the bottom represent the individual frames over a cardiac cycle at a certain anatomical level. The left ventricular endocardial and epicardial contours were generated using semiautomatic contour detection. From the contours in all the frames and slices, a three dimensional model can be reconstructed that can also be used as a functional display representing regional wall thickening/thinning. Reproduced from van der Geest et al. J Comput Assist Tomogr 1997;21:756-65, with permission of the publishers.
MR imaging of the cardiac anatomy
The presence of tumours or other masses involving the cardiac chambers, the pericardium, and extra cardiac structures can be reliably assessed with MRI.16
Limitations of MR imaging
Devices and metallic objects within the body may present a potential hazard for the patient. These objects may cause image artefacts, induce electric currents, cause excessive heating, or may move within the tissues. Patients with pacemakers and implantable defibrillators should not undergo MR imaging. Claustrophobia occurs in 2% of the patients, but the “open” configuration of new scanners will reduce this problem.
Electron beam tomography: physics and technique
EBT is a tomographic x ray technique whereby only the structures in a selected slice (tomogram) of the patient are imaged sharply. The x ray photons passing through the body are differentially absorbed by the tissue, thus creating object contrast from which an image is reconstructed.
The EBT scanner is a dedicated ultrafast cardiac scanner, which is able to acquire tomograms within 100 ms.17 This fast acquisition is achieved because, unlike “conventional” computed tomographic (CT) scanners, there is no need to rotate thex ray source around the patient (which is energy and time consuming); rather the patient is positioned within a fixed source detector combination where xrays are produced with an electronically steered electron beam. The acquisition is obtained at a predetermined relative motion free diastolic acquisition period, which is determined by high resolution ECG with triggering usually set at 80% of the RR interval. Breathholding is necessary during acquisition of the tomograms to avoid respiratory motion artefacts. The tomogram thickness is set at 1.5 or 3 mm. Scanning is performed with the patient in supine position on the table. After each tomogram the table increment is set at 1.5 or 2 mm, resulting in contiguous non-overlapping slices or slices with 1 mm overlap. One tomogram is made during each RR interval. To completely cover the heart 40 to 60 transaxial tomograms are made during one breath hold. The data are obtained after injection of 150 ml contrast medium at 4 ml/s through an antecubital vein.
The high contrast in-plane resolution is approximately 0.8 × 0.8 mm (6 line pairs/cm). The radiation exposure is estimated to be one third of that of a diagnostic coronary angiogram.
The image is constructed from many one dimensional projections, which are used to reconstruct a single slice of data (fig 5). A three dimensional data set is obtained by stacking many two dimensional tomograms from which three dimensional reconstructions are made usually using a surface shaded rendering or a volume rendering technique.


Schematic of EBT scanning to reconstruct a three dimensional image. ID, one dimensional; 2D, two dimensional; 3D, 3 dimensional.
EBT to assess coronary arteries
During contrast injection the mean CT density within the coronary arteries is about 165–200 Hounsfield units (HU) while the mean density of the myocardium (85–100 HU) and connective tissue (100 HU) is much lower, thus allowing visualisation of the contrast filled coronary lumen.
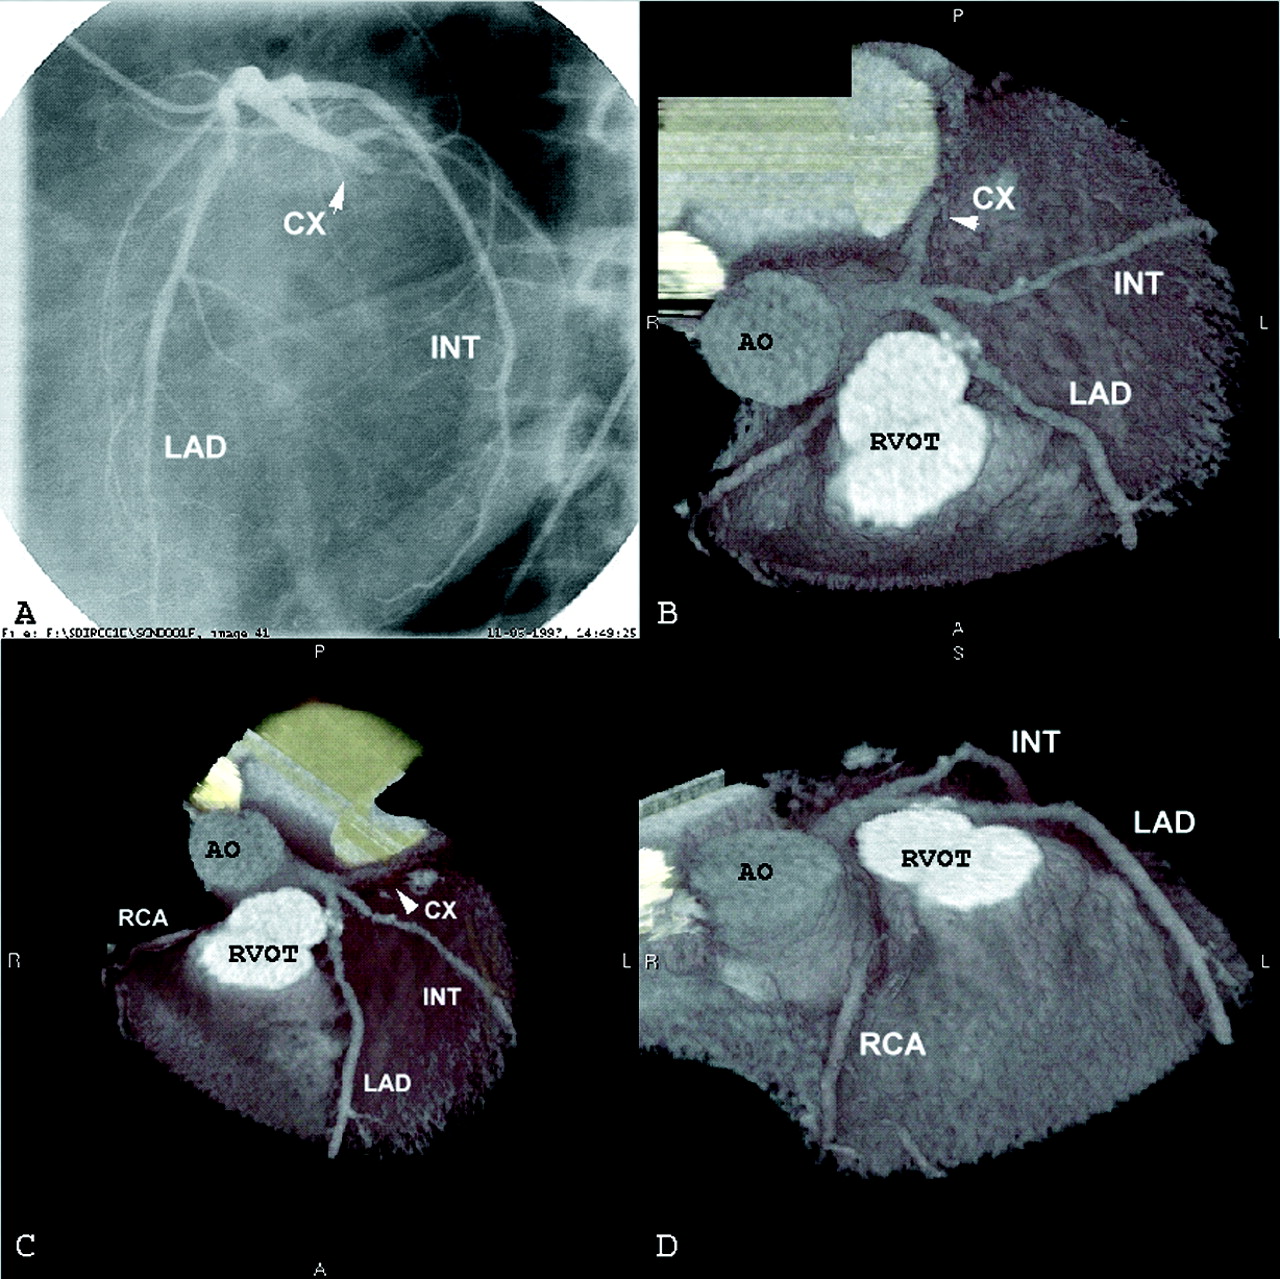
So far the results of healthy volunteers and approximately 300 patients have been published. In 75–80% of the cases the image quality is sufficient to allow reliable interpretation of the coronary arteries (fig 6).17-19

EBT of coronary arteries with view from top (B), from a more anterior angle (C), and from a lateral angle (D). The left circumflex (CX) artery is totally occluded. A: corresponding coronary angiography. AO, aorta; INT, intermediate coronary branch; LAD, left anterior descending coronary artery; RCA, right coronary artery, RVOT, right ventricular outflow tract.
The sensitivity to detect significant coronary stenosis ranges from 75–90% and the specificity from 80–94%.
The diagnostic accuracy of EBT coronary angiography is highest in the left main artery and proximal and mid parts of the left anterior descending coronary artery, and moderate in proximal and mid parts of the right (RCA) and left circumflex (LCX) arteries. The distal coronary segments cannot be visualised.
Misdiagnosis is caused by cardiac motion artefacts (in particular of the RCA and LCX), inadvertent respiratory motion, overlapping anatomical structures, triggering problems due to irregular heart rhythm, and lumen interpretation problems in cases of severe overlying calcifications. Total coverage of the heart requires a rather long breath hold (for example, with a heart rate of 60 bpm and slice thickness of 3 mm, a 20 second breath hold covers 6 cm from base to apex) which is not always possible in patients.
EBT to assess bypass graft patency
Initially EBT was able to establish only the patency of coronary venous and arterial bypass graft patency by assessment of the individual transaxial angiograms. The diagnostic accuracy was high with a sensitivity of 95% and a specificity of 86–97%.17 The recently introduced three dimensional rendering techniques were able to reconstruct the graft completely and thus allow assessment of non-occluding obstructions (fig 7). The diagnostic accuracy to detect significant graft obstructions was high, with sensitivity ranging from 92–100% and specificity from 91–100%.

Visualisation of sequential venous bypass graft without significant stenoses.
EBT for quantification of coronary calcification
To detect coronary calcium usually 20–30 contiguous, 3 mm EBT slices acquired at 100 ms are obtained. The tomograms, which are acquired during one breath hold, are triggered from an ECG at 80% of the RR interval to minimise cardiac motion. Coronary calcium in the wall has a high density relative to blood and thus is easily detected (fig 8). The EBT scanner software allows the quantification of calcium area and density. CT attenuation of tissue is about ± 50 HU and arbitrarily a density of 130 HU and more are assumed to be calcium. The calcium scoring algorithm from Agatson is frequently used to calculate the amount of calcium.20 Calcium densities of 130–200 HU are assigned a score of 1, between 201–300 HU a score of 2, between 301–400 HU a score of 3, and > 401 HU a score of 4. These peak calcium density values are multiplied by the actual area (mm2) of calcification per coronary tomographic segment to obtain the score. The score can be given per specific coronary artery or for the entire coronary system (the sum of the individual scores).

Example of coronary calcification score. Blue dots in the left anterior descending artery represent calcification.
EBT is extremely sensitive in defining coronary vascular calcification, and the presence of coronary calcium is always indicative of coronary atherosclerosis.21 The presence of calcification does not equate with the presence of a significant coronary stenosis, however, and the absence of calcification does not exclude a coronary lesion, including a vulnerable plaque, but the likelihood of the latter is low. There is a direct relation between the magnitude of the calcium score and the extent of the underlying coronary plaque burden and the presence of a severe coronary stenosis. However, site and extent of calcification do not equate with site specific stenosis, and a calcific plaque does not mean a stable plaque.
There appears to be a relation between the presence of coronary calcification and the occurrence of adverse coronary events in asymptomatic individuals.21 ,22 The place and role of EBT as a screening tool to predict coronary events, independent of the conventional risk factors such as hypertension, smoking, hypercholesterolaemia, diabetes, and family history, is controversial and requires more data before EBT can be recommended in low risk asymptomatic patients.
Future EBT coronary imaging
Although EBT has a high temporal (100 ms) and high in-plane spatial resolution (0.8 mm × 0.8 mm), with image acquisition triggered to the ECG, its performance is not yet sufficiently robust for reliable coronary visualisation. Technical improvements may be expected, such as doubling the number of detector elements, so that the in-plane resolution may improve from 6 line pairs/cm to 10 line pairs/cm or reducing the tomogram acquisition time from 100 ms to 50 ms.
Coronary imaging with EBT is promising because calcium quantification provides information on the plaque burden of the coronary arteries, and contrast enhanced CT may reliably determine the severity of obstructive disease.
Clinical role of EBT in cardiac disease
Established role:
detection and quantification of coronary calcium
Emerging role:
visualisation of coronary arteries
visualisation of bypass grafts
Under investigation:
quantification of calcium in symptomatic patients and asymptomatic individuals
Potential role:
left ventricle anatomy and function
right ventricle anatomy and function
myocardial perfusion
Conclusion
A major question, given the cost constraints for a potential interested party, is which technique—MRI or EBT—should one purchase?
This largely depends on the purpose for which the technique will be used. If one is interested in visualising coronary arteries or venous bypass grafts EBT seems more robust than MRI.
Visualisation of the heart chambers and cardiac masses can be achieved equally effectively by both techniques. MRI is superior for studying left ventricular function and perfusion, and obviously flow can only be determined by MRI (although it is still in its early phase of development).
References
Linked Articles
- Correction