Article Text

Statistics from Altmetric.com
When confronted with a tachycardia having a broad QRS complex, it is important to be able to differentiate between a supraventricular and a ventricular tachycardia. Medication given for the treatment of a supraventricular tachycardia (SVT) may be harmful to a patient with a ventricular tachycardia (VT).1 ,2 A reasonable haemodynamic condition during a tachycardia may erroneously lead to the wrong diagnosis of SVT.3 Familiarity with the ECG signs allowing the diagnosis of a VT is therefore essential. But as will be discussed here, the ECG should not only tell you how to distinguish VT from other tachycardias with a broad QRS complex, but also to suspect its aetiology and its site of origin in the ventricle. Both aspects are important in decision making about the prognostic significance of VT and correct treatment.
Classification of tachycardias with a broad QRS complex
As shown in fig 1, broad QRS tachycardia can be divided in three groups.
SVT with bundle branch block—Bundle branch block (BBB) may be pre-existing or can occur when the refractory period of one of the bundle branches is reached because of the heart rate of the SVT (so called tachycardia related or phase 3 block). BBB can also occur because of retrograde invasion in one of the bundle branches.4 These causes of BBB can be found in patients with atrial tachycardia, atrial flutter, atrial fibrillation, atrioventricular (AV) nodal tachycardia, and also during orthodromic circus movement tachycardia (with AV conduction over the AV node and ventriculo-atrial (VA) conduction over an accessory AV pathway).
SVT with AV conduction over an accessory AV pathway—This may occur during atrial tachycardia, atrial flutter, atrial fibrillation, AV nodal tachycardia, and during antidromic circus movement tachycardia (with AV conduction over an accessory AV pathway and VA conduction over the AV node or a second accessory AV pathway). It is also the case in the so called Mahaim tachycardia where AV conduction goes by way of a slowly conducting right sided accessory AV pathway or a nodo-ventricular fibre inserting into the right ventricle.
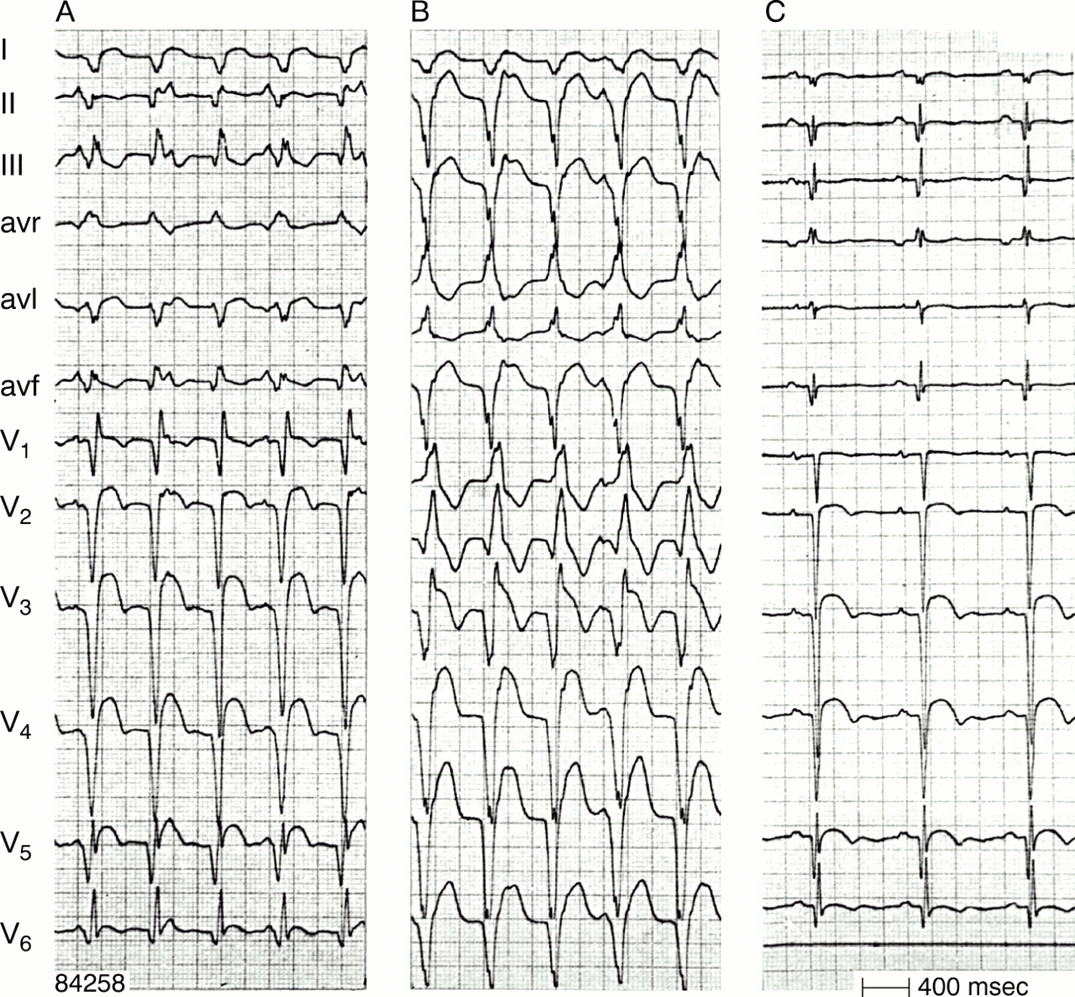
Ventricular tachycardia.

Different types of SVT with BBB (diagram A), SVT with AV conduction over an accessory pathway (diagram B), and VT (diagram C) resulting in a broad QRS tachycardia. Acc, accessory; AV, atrioventricular; BBB, bundle branch block; CMT, circus movement tachycardia; SVT, supraventricular tachycardia; VA, ventriculo-atrial; VT, ventricular tachycardia.
The ECG diagnosis
Importance of AV dissociation
Although dissociation between atrial and ventricular activity during tachycardia is a hallmark of VT (fig 2), some form of VA conduction can be present during VT, especially at slow VT rates (fig3).4 P waves can be difficult to recognise during a broad QRS tachycardia and it is always useful to look for non-electrocardiographic signs such as variations in jugular pulsations, the loudness of the first heart sound, and changes in systolic blood pressure.5

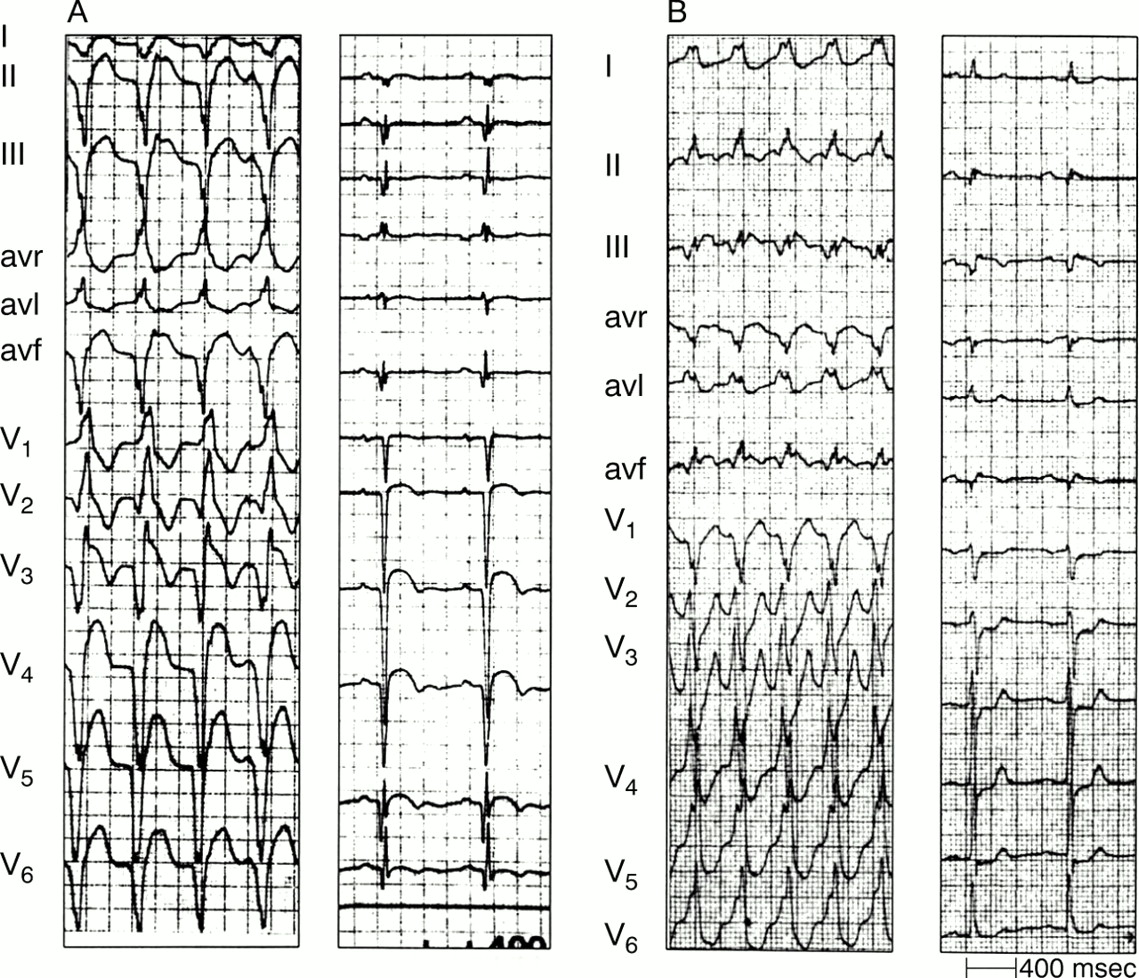
Two types of VT (panel A and B) in the same patient (panel C during sinus rhythm). Atrioventricular dissociation is present during both VTs. Note the effect of the frontal plane axis on the R:S ratio in lead V6 in RBBB shaped VT. R:S < 1 is present in case of a superior axis (panel B), but R:S > 1 with an inferior axis (panel A).

One to one ventriculo-atrial conduction during VT. The p waves are negative in leads II, III, and avf and follow each QRS complex. Left panel—VT; right panel—same patient during sinus rhythm.
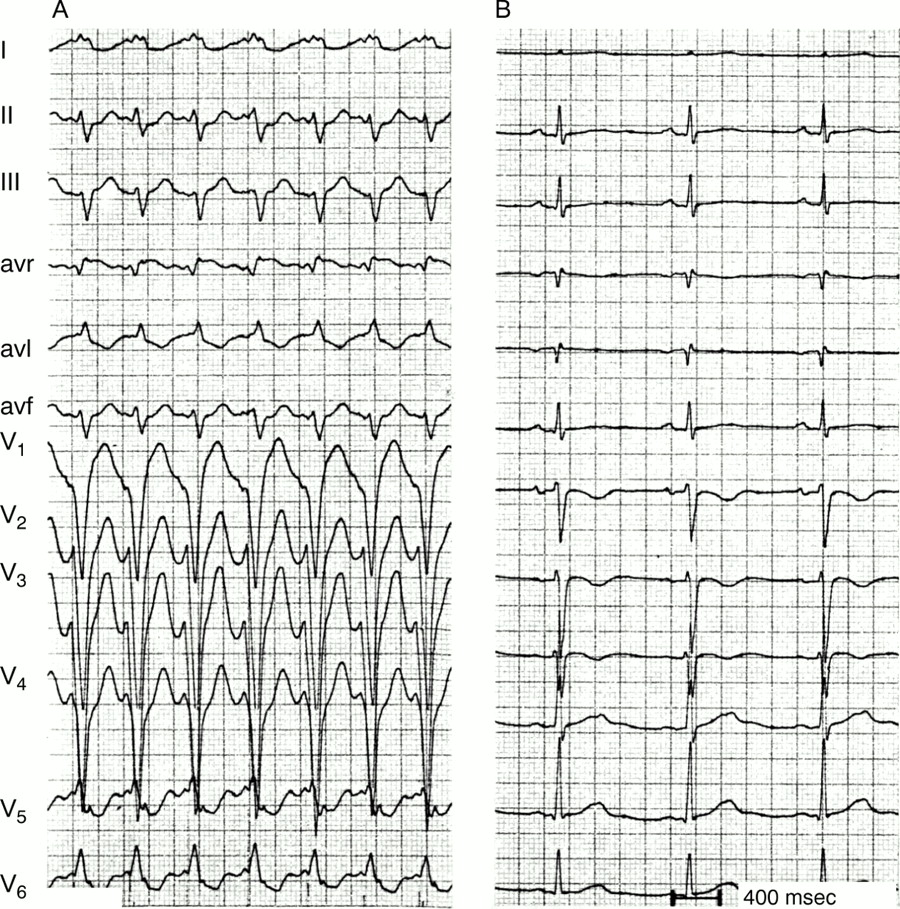
In patients with slow VT rates occasional conduction from atrium to ventricle over the AV node–bundle branch system may happen resulting in “capture” or “fusion” beats (fig 4). Sudden narrowing of a QRS complex during VT may also be the result of a premature ventricular depolarisation arising in the ventricle in which the tachycardia originates, or it may occur when retrograde conduction during VT produces a ventricular echo beat leading to fusion with the VT QRS complex.5 Very rarely, AV dissociation is present in tachycardias other than VT. It may occur in AV junctional tachycardia with BBB after cardiac surgery or during digitalis intoxication.

“Capture” (QRS complexes: 5, 13, and 15) and “fusion” beats (QRS complex number 8) during VT.
Width of the QRS complex
As depicted in fig 5, the site of origin of the VT plays a role in the width of the QRS complex. When the arrhythmia arises in the lateral free wall of the ventricle sequential activation of the ventricles occurs resulting in a very wide QRS. The QRS complex will be smaller when the VT has its origin in or close to the interventricular septum. Of course other factors also play a role in the QRS width during VT, such as scar tissue (after myocardial infarction), ventricular hypertrophy, and muscular disarray (as in hypertrophic cardiomyopathy). It is of interest that a QRS width of more than 0.14 seconds in right BBB (RBBB) tachycardias and 0.16 seconds during left BBB (LBBB) argues for a VT.4 But a QRS width below such values may occur in VTs having their origin in or close to the interventricular septum. Of course, QRS width is not helpful in differentiating VT from a tachycardia with AV conduction over an accessory AV pathway because such a pathway inserts into the ventricle leading to eccentric ventricular activation and a wide QRS complex (fig 6).

VT origin and QRS width. Upper panel: an origin close to the interventricular septum results in more simultaneous right and left ventricular activation and therefore a more narrow QRS complex. In contrast (lower panel) a VT origin in the lateral ventricular wall results in sequential ventricular activation and a wider QRS complex.

An antidromic circus movement tachycardia with AV conduction over a right sided accessory pathway. The insertion of the accessory pathway in the free wall of the right ventricle results in sequential (right to left) ventricular activation and a wide QRS complex.
An SVT can have a QRS width of more than 0.14 (RBBB) or 0.16 (LBBB) seconds under three circumstances: (1) in the presence of pre-existent BBB in the elderly with fibrosis in the bundle branch system and ventricular myocardium; (2) when during SVT AV conduction occurs over an accessory AV pathway; (3) when class IC drugs (especially flecainide) are present during SVT.
QRS axis in the frontal plane
The QRS axis is not only important for the differentiation of the broad QRS tachycardia but also to identify its site of origin and aetiology. As shown in fig 7, a VT origin in the apical part of the ventricle has a superior axis (to the left of −30). An inferior axis is present when the VT has an origin in the basal area of the ventricle. Previous work4 showed that the presence of a superior axis in patients with RBBB shaped QRS very strongly suggests VT. This does not hold for an LBBB shaped tachycardia. On the contrary, presence of an inferior axis in LBBB shaped QRS tachycardia argues for a VT arising in the outflow tract of the right ventricle.
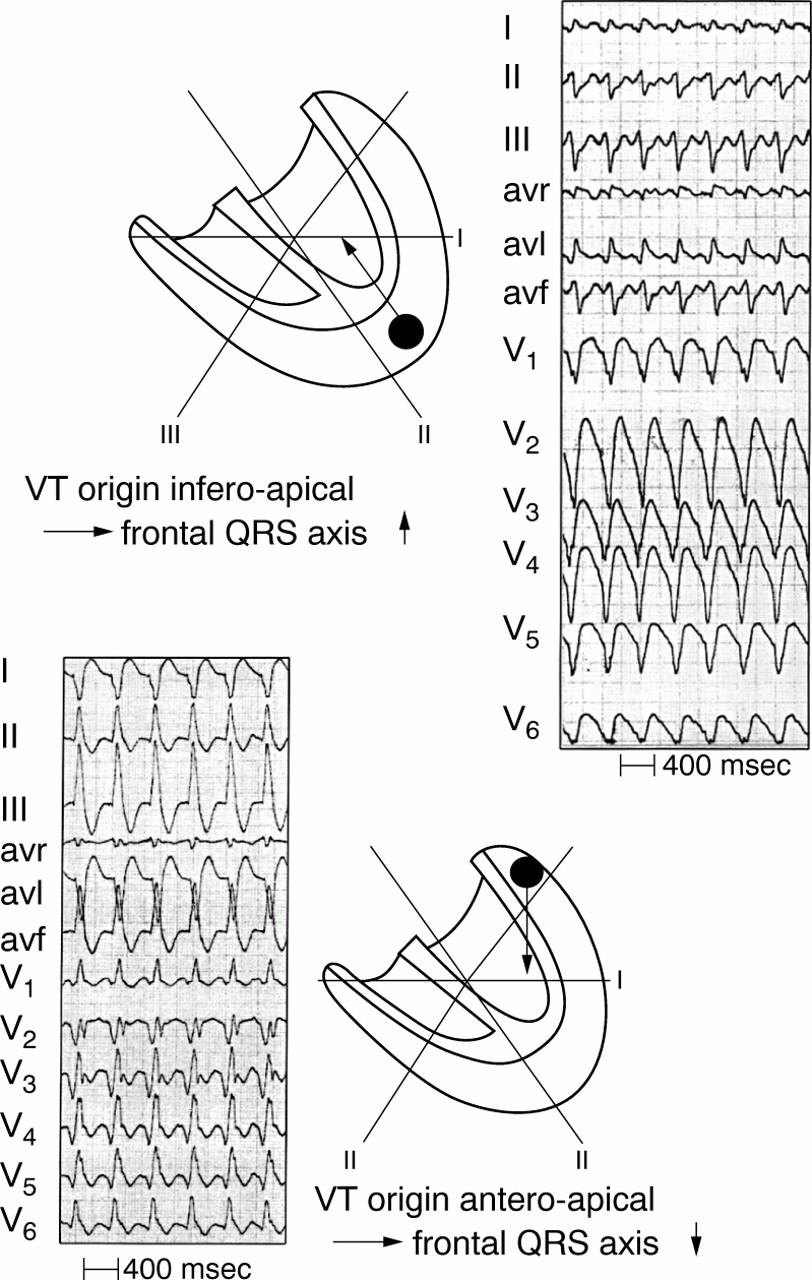
VT origin and QRS axis. An apical origin results in a superiorly directed axis in the frontal plane. In contrast, a basal origin leads to an inferior QRS axis (lower panel).
Configurational characteristics of the QRS complex
Leads V1 and V6
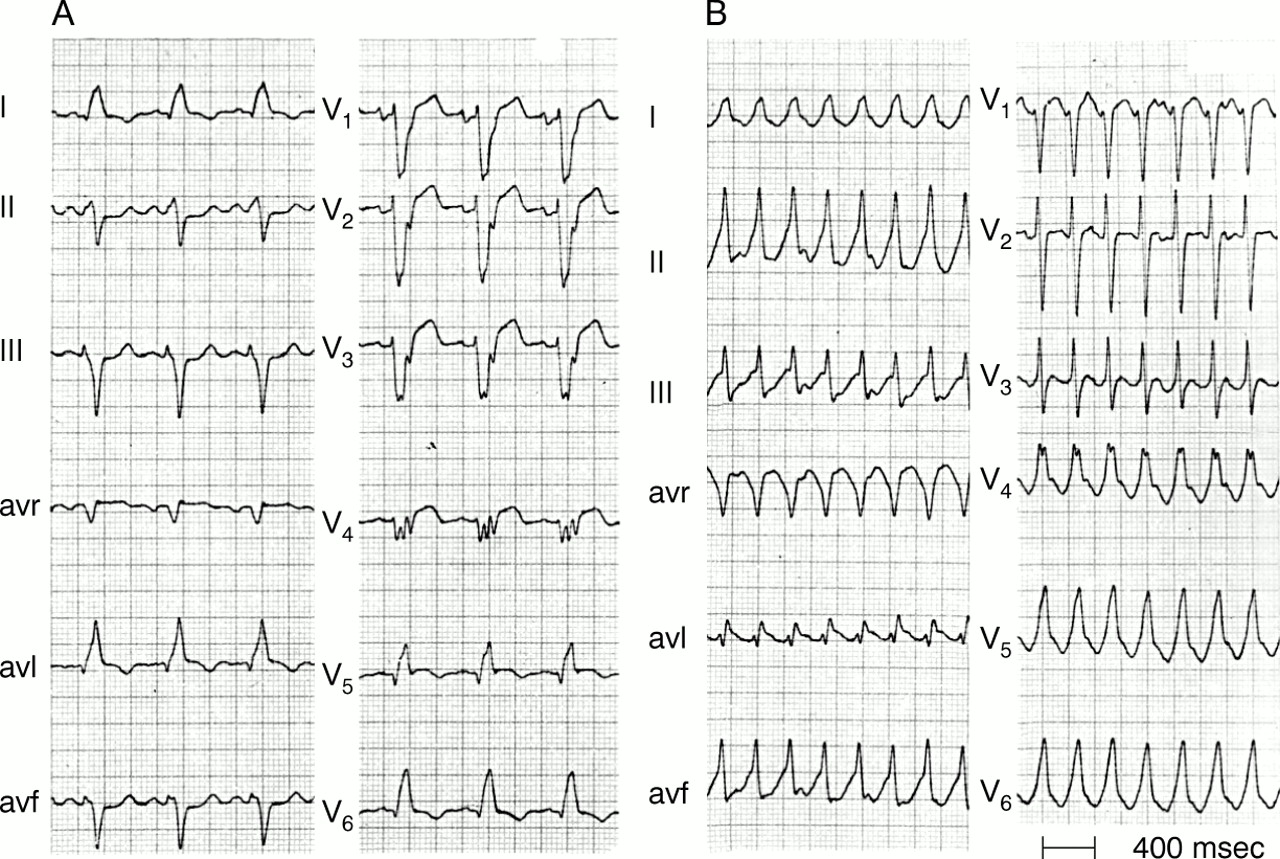
Marriott6 described that in RBBB shaped tachycardia, presence of a qR or R complex in lead V1 strongly argued for a ventricular origin of the tachycardia, while a three phasic (RSR) pattern suggested a supraventricular origin. Apart from lead V1, lead V6 can also be very helpful in correctly differentiating RBBB shaped tachycardia. When in V6 the R:S ratio is < 1, a VT is very likely.4 As shown in fig 2B an R:S ratio < 1 in V6 is typically found when there is left axis deviation in the frontal plane. If the axis is inferiorly directed, lead V6 often shows an R:S ratio > 1 (fig 2A). In LBBB shaped VT, lead V1 (and also V2) (fig 8) shows: an initially positive QRS with positivity measuring more than 0:03 seconds; slurring or notching of the downstroke of the S wave; and an interval between the beginning of the QRS and the nadir of the S wave of 0.07 seconds or more.7 When lead V6 shows a qR pattern during LBBB shaped tachycardia, VT is very likely. In SVT with LBBB, lead V1 shows no or minimal initial positivity, a very rapid downstroke of the S wave, and a short interval between the beginning of the QRS and the nadir of the S wave (fig 9).

Findings in lead V1 and V2 during LBBB shaped tachycardia pointing to a ventricular origin (see text).

SVT with LBBB. In panel A LBBB changes during tachycardia into a narrow QRS following a ventricular premature beat. As described in the text, lead V1 during LBBB clearly shows signs pointing to a supraventricular origin of the tachycardia.
Interval onset QRS to nadir of S wave in precordial leads
Brugada and colleagues8 suggested that an RS interval > 100 ms in one or more precordial leads is highly suggestive for VT. One should be careful, however, because such a duration may occur in SVT with AV conduction over an accessory pathway, SVT during administration of drugs that slow intraventricular conduction (in particular, flecainide), and in SVT with pre-existent BBB, especially LBBB.
Concordant pattern
When all precordial leads show either negative or positive QRS complexes this is called negative or positive concordancy. Negative concordancy is diagnostic for a VT arising in the apical area of the heart (fig 10). Positive concordancy means that in the horizontal plane ventricular activation starts left posteriorly. This can be found either in VT originating in the left posterior wall or during tachycardias using a left posterior accessory AV pathway for AV conduction (fig 10).

Concordant pattern. The left panel shows a VT arising in the apical area of the left ventricle resulting in negative concordancy of all precordial leads. In the right panel ventricular activation starts in the left posterior area, resulting in positive concordancy of all precordial leads. The latter can be found in left posterior VT but also in SVT with AV conduction over a left posterior accessory pathway.
Tachycardia QRS more narrow than sinus QRS
When during tachycardia the QRS is more narrow than during sinus rhythm a VT should be diagnosed. As shown in fig 11, a very wide QRS is present during sinus rhythm because of sequential activation of first the right and then the left ventricle. During tachycardia the QRS is more narrow. This can only be explained by a ventricular origin close to the intraventricular septum, resulting in more simultaneous activation of the right and left ventricle than during sinus rhythm.
Tachycardia QRS smaller than QRS during sinus rhythm. On the left sinus rhythm is present with a very wide QRS because of anterolateral myocardial infarction and pronounced delay in left ventricular activation. On the right a VT arising on the right side of the interventricular septum results in more simultaneous activation of the right and left ventricle than during sinus rhythm and therefore a smaller QRS complex.
Presence of QR complexes
Coumel and colleagues9 called attention to the significance of a QR (but not a QS) complex during a broad QRS tachycardia, showing that their presence indicates a scar in the myocardium usually caused by myocardial infarction. Figure 12 gives an example of QR complexes during VT in patients with an anterior (panel A) and an old inferior myocardial infarction (panel B). QR complexes during VT are present in approximately 40% of VTs after myocardial infarction.10

QRS complexes during VT indicating a myocardial scar. As shown by the accompanying tracing, during sinus rhythm anterior wall myocardial infarction is present in the left panel and inferior wall myocardial infarction in the right one.
Aetiology of VT
Most VTs have a previous myocardial infarction as their aetiology and, as pointed out, a QR complex during VT can be very helpful to make that diagnosis. However, characteristic ECG patterns can also be found in idiopathic VT11 and VT in patients with arrhythmogenic right ventricular dysplasia (ARVD).12 Figure 13 shows three patterns of idiopathic VT arising in or close to the outflow tract of the right ventricle. All three have an LBBB-like QRS complex indicating a right ventricular origin. In panel A the frontal QRS axis is +70 and lead 1 shows a positive QRS complex, indicating an origin of the tachycardia in the lateral part of the outflow tract of the right ventricle. In panel B the frontal QRS axis is inferior and the QRS is negative in lead 1, pointing to an origin on the septal side in the right ventricular outflow tract. In panel C an inferior frontal QRS axis and QRS negativity in lead 1 are also present, but leads V1 and V2 clearly show initial positivity of the QRS complex. This is a tachycardia not arising on the endocardial surface of the right ventricular outflow tract but epicardially in between the root of the aorta and the posterior part of the outflow tract of the right ventricle. It is important to recognise this pattern because this site of origin of the VT cannot be treated with catheter ablation in contrast to the tachycardias depicted in panel A and B.
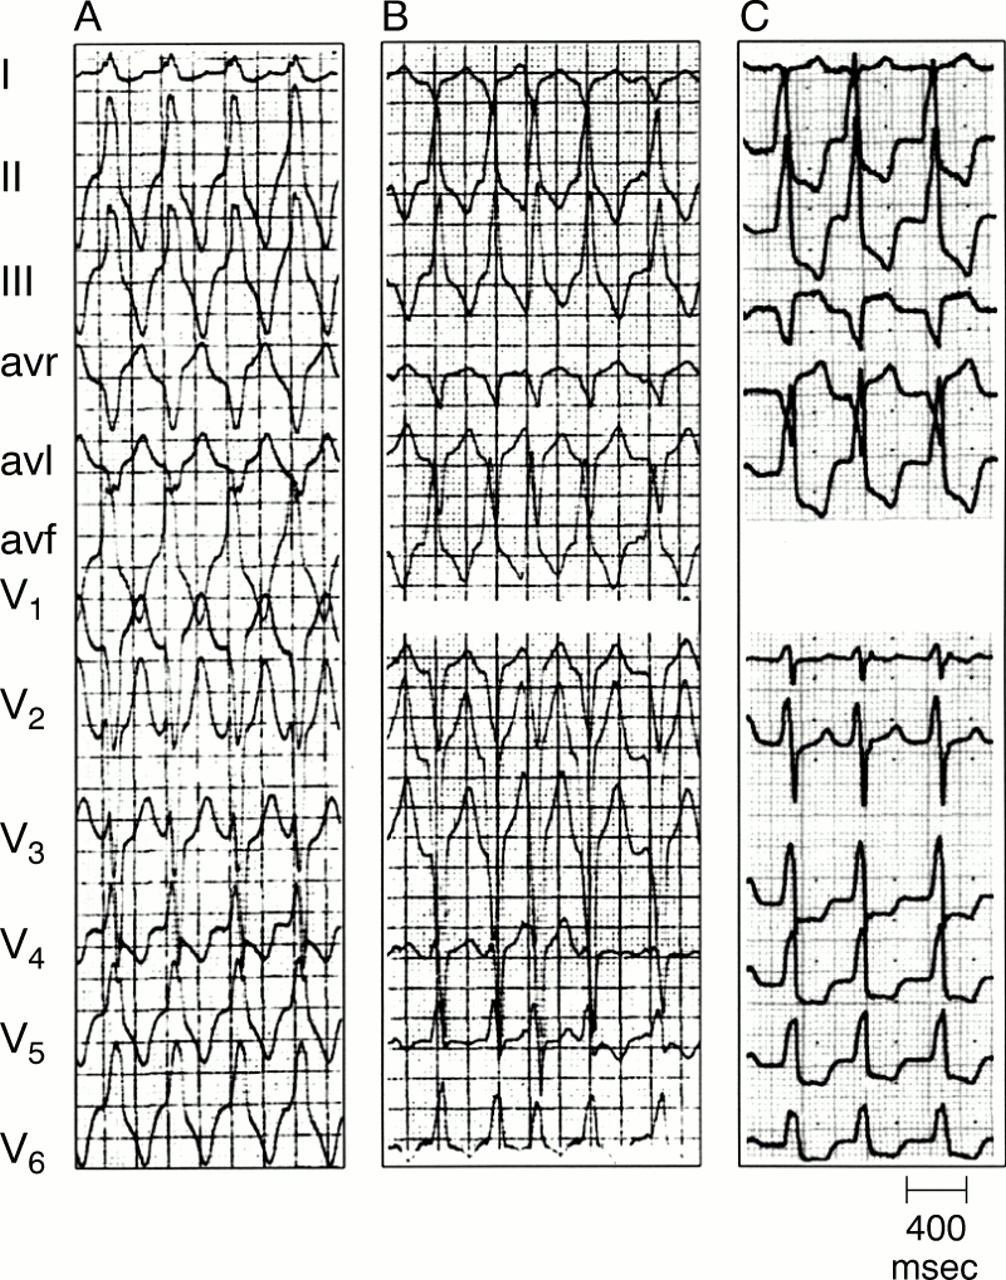
Three types of idiopathic VT arising in or close to the outflow tract of the right ventricle (see text).
The QRS configuration in idiopathic left VT is shown in fig 14. They all have an RBBB shape because of an origin in the left ventricle. The most common type is shown in panel A. The frontal QRS axis shows left axis deviation. The site of origin of the VT is in or close to the posterior fascicle of the LBB. In panel B the frontal QRS axis is further leftward (a so called north-west axis). This tachycardia arises more anteriorly close to the interventricular septum. The least common idiopathic left VT is the one shown in panel C. Now the frontal QRS axis is inferiorly directed. This VT originates in the anterior fascicle of the LBB. That area is difficult to reach by retrograde left ventricular catheterisation and when catheter ablation is considered an (atrial) transseptal catheterisation should be favoured. In ARVD there are three predilection sites in the right ventricle: the inflow and outflow tracts, and the apex. While the first two sites have a QRS configuration during tachycardia which is difficult to differentiate from right ventricular idiopathic VT, left axis deviation in a young person with an LBBB shaped VT should immediately lead to the suspicion of ARVD. In fact, there is an important rule in LBBB shaped VT with left axis deviation that cardiac disease should be suspected and that idiopathic right ventricular VT is extremely unlikely.
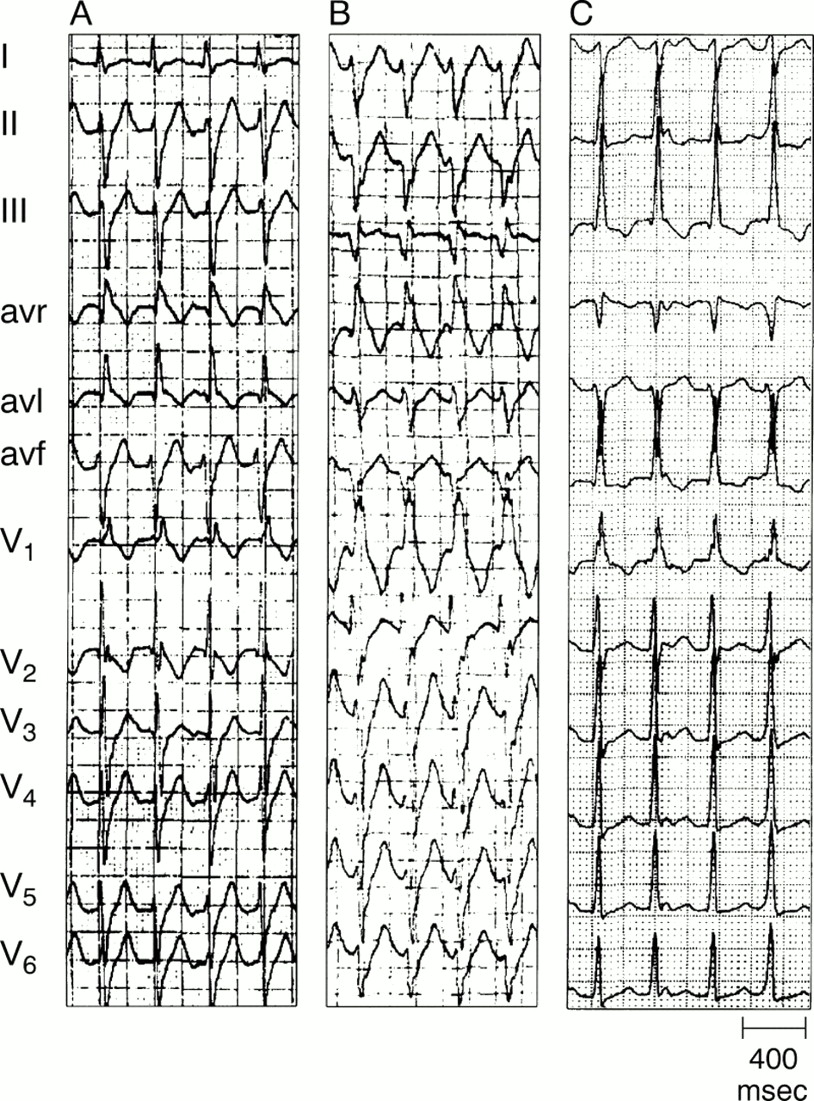
Three types of left ventricular idiopathic VT (see text).
Figure 15 gives an example of an LBBB shaped VT in a patient with ARVD. When the broad QRS is identical during tachycardia and sinus rhythm, one has to differentiate SVT with pre-existent BBB from bundle branch re-entrant tachycardia.13 In diseased hearts, especially when the bundle branches and the interventricular septum are involved, a tachycardia may occur based upon a circuit with anterograde conduction down one bundle branch or one of the left sided fascicles and after septal activation retrograde conduction over another branch of the bundle branch system (fig16).

VT in arrhythmogenic right ventricular dysplasia (ARVD). VT shows LBBB shape and left axis deviation indicating an origin in the apex of the right ventricle. Note also the negative T waves in V1–V3 during sinus rhythm, which is often found in ARVD.

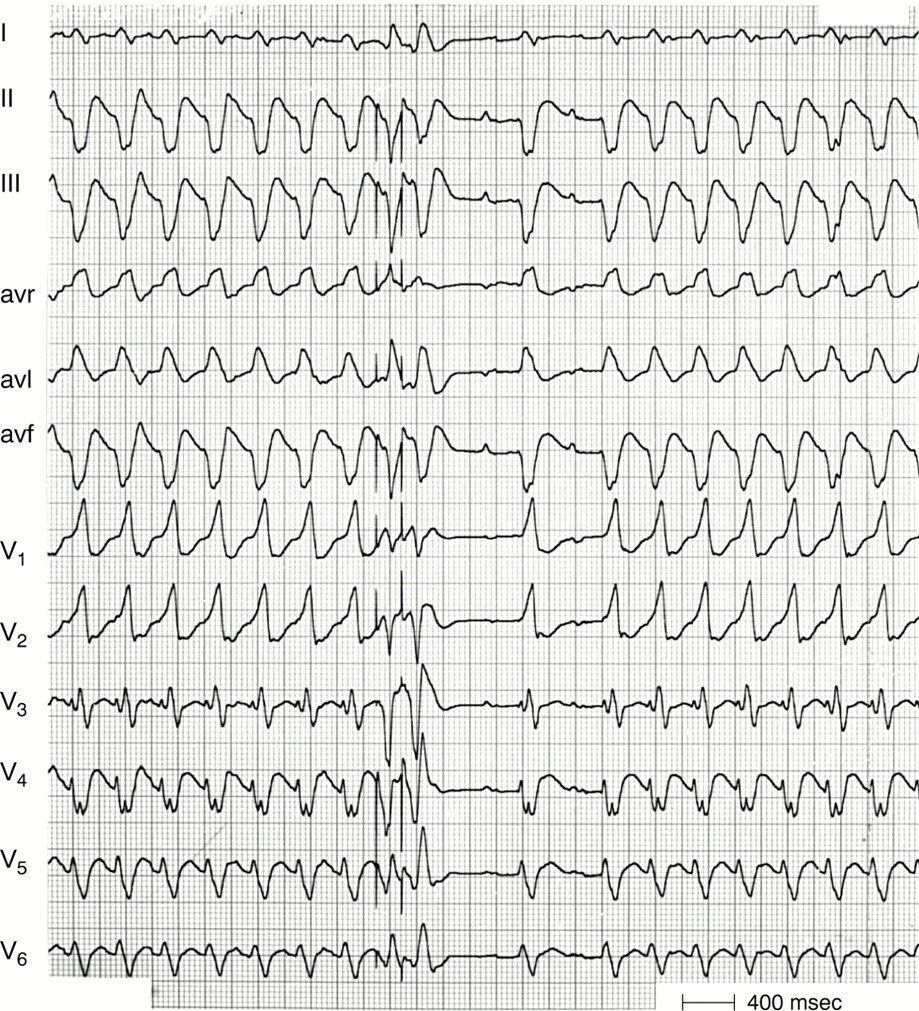
Bundle branch re-entry VT. Following two electrically induced premature beats the tachycardia terminates in the middle of the recording. However, tachycardia resumes after two conducted sinus beats. The QRS is identical during sinus rhythm and tachycardia. Note the presence of AV dissociation during tachycardia indicating a ventricular origin.
This type of re-entry may occur in patients with anteroseptal myocardial infarction, idiopathic dilated cardiomyopathy, myotonic dystrophy, after aortic valve surgery, and after severe frontal chest trauma.
Value of the ECG during sinus rhythm
The ECG during sinus rhythm may show changes such as pre-existent BBB, ventricular pre-excitation, or an old myocardial infarction which are very helpful in correctly interpreting the ECG during broad QRS tachycardia. Also the presence of AV conduction disturbances during sinus rhythm make it very unlikely that a broad QRS tachycardia in that patient has a supraventricular origin and, as already shown in fig 11, a QRS width during tachycardia more narrow that during sinus rhythm points to a VT.
Value and limitations of ECG findings in diagnosing broad QRS tachycardia
AV dissociation suggests VT, but VA conduction may be present during VT
A QRS width of > 160 ms suggests VT, but need to rule out:
pre-existent BBB (especially LBBB)
SVT with AV conduction over an AP
use of drugs slowing intraventricular conduction (flecainide).
Keep in mind—VT arising close to or in the intraventricular conduction system may have a width of < 140 ms
Left axis deviation (to the left of −30) suggests VT, but is not helpful in:
LBBB shaped QRS
SVT with conduction over a right sided or posteroseptal AP
SVT during use of class 1 C drugs
Right axis deviation (to the right of +90) suggests VT in LBBB shaped QRS
Concordant pattern in precordial leads suggests VT, but positive concordancy may occur during SVT with AV conduction over a left posterior AP
R nadir S > 100 ms in one or more precordial leads suggests VT, but may be found in:
SVT on drugs slowing intraventricular conduction
SVT with AV conduction over an AP
pre-existent BBB (especially LBBB)
QR complexes during VT suggest previous myocardial infarction as aetiology
AP, accessory pathway; AV, atrioventricular; BBB, bundle branch block; LBBB, left bundle branch block; SVT, supraventricular tachycardia; VA, ventriculo-atrial; VT, ventricular tachycardia
Conclusion
Do not panic when confronted with a broad QRS tachycardia. Look for clinical signs of AV dissociation and evaluate the 12 lead ECG systematically (see box above). Also, when available, look at the 12 lead ECG during sinus rhythm. This approach usually gives the correct diagnosis of VT versus SVT. Keep in mind that statistically VT is much more common than SVT in the broad QRS tachycardia. Never make the mistake of rejecting VT because the broad QRS tachycardia is haemodynamically well tolerated. When in doubt, do not give verapamil or adenosine; procainamide should be used instead.
Linked Articles
- Miscellanea