Article Text

Statistics from Altmetric.com
- BCS, British Cardiovascular Society
- CHD, coronary heart disease
- CRT, cardiac resynchronisation therapy
- ICD, implantable cardioverter-defibrillator
- NICE, National Institute for Health and Clinical Excellence
- NSF, National Service Framework
- PCI, percutaneous coronary intervention
In 1998 the UK government devolved power to elected assemblies in Scotland, Wales and Northern Ireland. Although the powers of these political bodies differ, they all have important freedoms with respect to health care and have pursued different policies. In England, the emphasis has been on targets introduced through National Service Frameworks. Scotland has concentrated on health promotion and the development of managed clinical networks led by healthcare professionals and patients. Wales has focused on public health partnerships, and developments in Northern Ireland have stalled since the elected assembly was suspended in 2002.
The National Service Framework (NSF) for coronary heart disease (CHD)1 was published in 2000 and has facilitated dramatic and tangible improvements in the provision of cardiac services in England. Amid concerns that the devolved nations had been disadvantaged by exclusion from the NSF, the Council of the British Cardiac Society (BCS)* appointed a working group to examine variations in the provision of cardiac services within the UK in 2004. Despite some methodological difficulties, the working group found clear evidence of major differences in service provision, activity and planning that were not related to need.2 The report attracted a lot of interest and an accompanying editorial highlighted the need to monitor progress by conducting further surveys.3 The Council of the BCS therefore conducted a second survey of the provision of cardiac services in the four UK nations.
THE WORKING GROUP
The working group comprised representatives from each of the four devolved nations and the British Society of Echocardiography (see appendix).
SCOPE OF THE REPORT
The group has not attempted to report on every aspect of cardiac services but has instead collected data on some core activities, many of which were described in the first report. To assess rate of change of data, annual statistics have, whenever possible, been presented for the past five years.
Some parameters described in the first report have been omitted (for example, cardiac surgery and the number of cardiac catheterisation laboratories) but new ones (for example, the use of cardiac resynchronisation therapy (CRT)) have been added. Special attention has been given to the provision of echocardiography by means of data provided by the British Society of Echocardiography. Future reports will concentrate on other facets of cardiac services.
Data for each country were collected from the same source according to common definitions. These data have been corrected for the population served by using denominators of 50 million for England, 5 million for Scotland, 3 million for Wales and 1.7 million for Northern Ireland.4 Some patients cross national borders to access specialist cardiac care; for example, about 700 000 people who live in North Wales rely on English centres for the provision of tertiary cardiac services. The working group has therefore, whenever possible, analysed and presented activity data by place of residence.
FINDINGS
Healthcare spending
National Health Service expenditure has increased rapidly over the past few years. Figures for expenditure on cardiac services are not available but total NHS spending increased by 67% in England between 1999–2001 and 2004–5; in contrast, the increases over the same period were 38% in Scotland, 47% in Wales and 43% in Northern Ireland.5 Nevertheless, England still has the lowest and Scotland the highest per capita expenditure (fig 1)6; spending is therefore still closely related to disease burden.

Current National Health Service spending (£) per capita.
Mortality from CHD
Age-adjusted CHD mortality has been falling across the UK for many years. The proportionate decline in mortality from 1999 to 2003 was similar in all four devolved nations7 (figs 2 and 3). Mortality, which is often used as a crude index of need, remains highest in the devolved nations and the north of England, and there is no sign of these gaps closing.7 In particular, death rates from CHD among Scottish women are worryingly high (fig 3).

Age-standardised death rates from coronary heart disease per 100 000 population for men aged 35–74. Data from the British Heart Foundation.7

Age-standardised death rates from coronary heart disease per 100 000 population for women aged 35–74. Data from the British Heart Foundation.7
Cardiology consultant staffing
The availability of consultant cardiologists is a crucial determinant of the quality of any cardiac service. Analysis of the cardiology workforce has been difficult because accurate data are hard to find and the definition of a cardiologist is not straightforward. The data presented here are derived from the most recent workforce study conducted by the Royal College of Physicians of London8 and a survey undertaken by the BCS for the specific purposes of writing this report.
The data for our survey were provided by the lead clinicians of individual managed clinical networks using a census date of 30 September 2005. We have tried to identify all consultant staff trained in cardiology who are on the specialist register and are responsible for patients with cardiac disease either full time or in conjunction with a general medical commitment. We have also tried to determine the number of new appointments made in the past three years, the number of long-term vacancies (posts unfilled for more than three months) and the proportion of cardiologists who have a significant general medical commitment (defined as participating in an unselected medical take) or academic (university) responsibilities.
The working group was reassured to find close agreement between the Royal College of Physicians data and our own survey.
The UK cardiology workforce has grown significantly over the past five years (fig 4, table 1). This has been most obvious in England (180 new posts advertised and appointed in the past three years), which initially had the fewest cardiologists per million population. Cardiologists are therefore now more equally distributed across the UK; nevertheless, staffing levels remain well below those reported in comparable western European countries9,10 and much lower than those recommended by the BCS workforce committee.
Results of the British Cardiac Society survey of UK cardiologists (census date 30 September 2005)

Cardiologists per million population by country. Data for 1999, 2000 and 2004 were derived from the Royal College of Physicians London census (there are no comparable data for Scotland in 1999). Data for 2005 were obtained from the British Cardiac Society survey.
Table 1 indicates that there are a significant number of long-term vacancies. Although it is not entirely clear what geographical or other factors make some consultant posts more attractive than others, most of the long-term vacancies reported to us were in the north of England or the devolved nations; moreover, almost all of these posts included general medical duties.
The proportion of time cardiologists spend on specialist activity seems to vary considerably across the UK. The vast majority (74%) of cardiologists in Northern Ireland are full-time specialists; in contrast, 65% of Welsh consultant cardiologists have important and apparently time-consuming general medical duties (table 1). These observations may partly explain the national differences in specialist activity (for example, percutaneous coronary intervention (PCI) and device implantation) described below.
Access rates for PCI
The number of patients treated by PCI has increased dramatically throughout the UK over the past five years (fig 5). In 2004 a total of 62 904 PCI procedures were undertaken in both NHS and private institutions throughout the UK (1052 per million population). Procedure numbers for individual countries (NHS only) and rates per million were as follows: England, 50 941 (1019 per million population); Scotland, 5095 (1019 per million population); Wales (allowing for 0.7 m of this population accessing English centres for their procedures), 1632 (725 per million population); and Northern Ireland, 1988 (1169 per million population).
Percutaneous coronary intervention procedures per million population by country of residence. Data provided by the British Cardiac Intervention Society.
The low PCI rate for Wales (which takes account of Welsh patients being treated in English centres) is a striking anomaly that cannot be explained by differences in need and is an important health inequality. Moreover, there is no sign that the gap between Wales and the other home nations is closing.
Use of drug-eluting stents during PCI
The pronounced increase in the use of drug-eluting stents illustrated in fig 6 reflects changes in evidence-based practice and the impact of National Institute for Health and Clinical Excellence (NICE) guidance.11 However, clearly there have been major national differences in the rate at which this new technology has been introduced. For example, patients in Northern Ireland were among the first to gain access to this form of therapy, while drug-eluting stent usage in Scotland has lagged behind the other countries.

Percentage of percutaneous coronary interventions with implantation of a drug-eluting stent by country. Data provided by the British Cardiac Intervention Society.
Pacemaker implantation
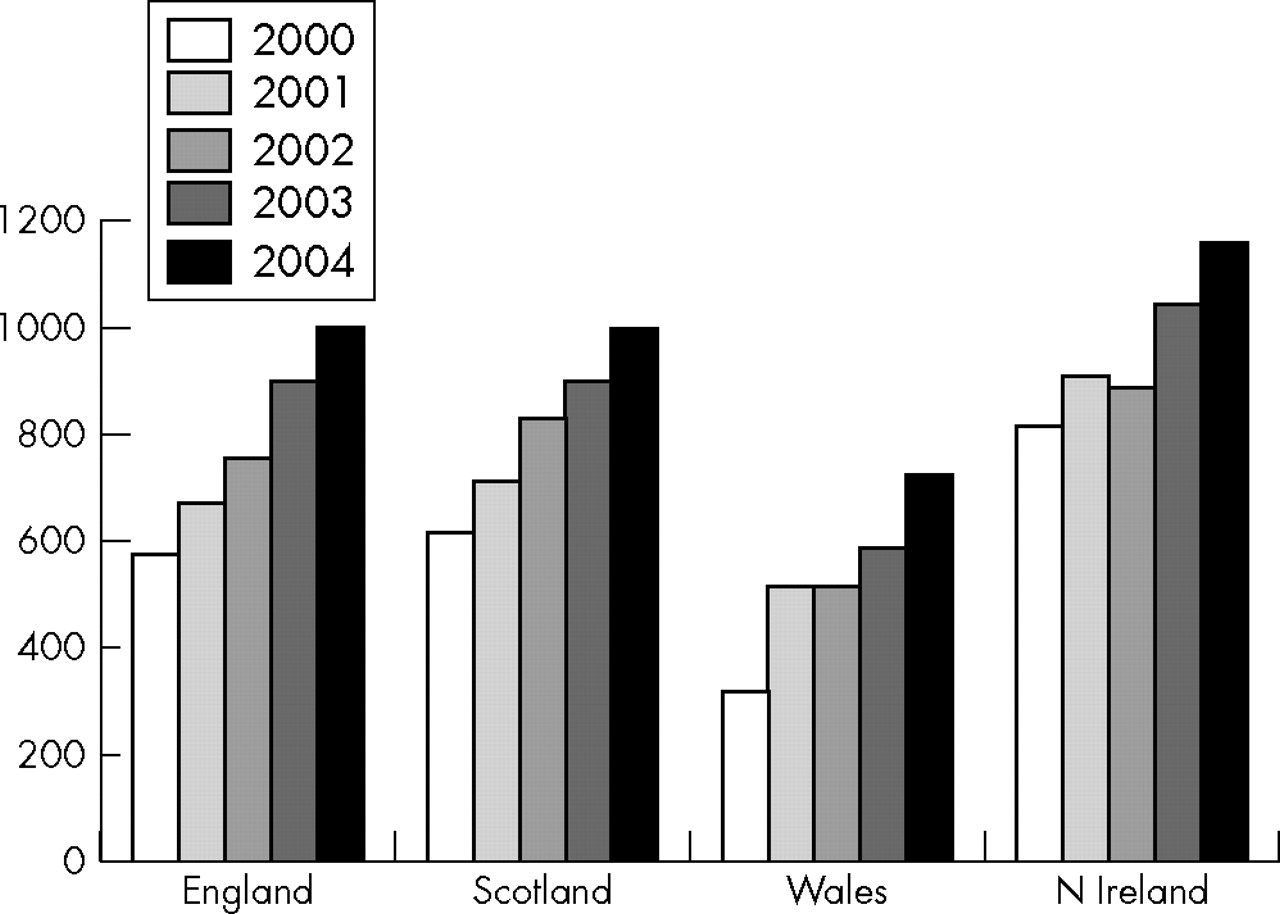
In 2004, about 31 000 new or replacement pacemakers were implanted in the UK (518 procedures per million).12 Pacing is now a well-established form of therapy and national implant rates vary less than other clinical activities. Nevertheless, new implant rates are still below the target of 450 per million13 in all UK countries (fig 7) and remain lowest in those countries with the highest cardiovascular mortality.

Pacemaker implant rates for new implants only (number per million population) by country of residence (9% of Welsh implantation procedures were done in England). Excludes devices with other functions such as cardiac resynchronisation therapy. Data provided by the National Pacemaker Database.12
Implantable cardioverter-defibrillator therapy
The implantable cardioverter-defibrillator (ICD) was introduced in 1980 and implants have been registered with the National Pacemaker Database since 1989. NICE published guidance on the indications for ICD therapy in 2000 when it was suggested that an implant rate of about 50 per million population would be appropriate for the UK as a whole.14
An analysis of audit data from the National Pacemaker Database for the period 1998–2002 has shown that the UK as a whole implants far fewer ICDs than most western European countries.15 Moreover, there are huge regional variations in implant rates across the UK that cannot be explained by differences in the prevalence of heart disease and must therefore reflect differences in clinical practice. Implant rates in Wales (adjusted to take account of the large numbers of patients who live in north Wales but are treated in England) have been consistently lower than those in the other UK countries. Moreover, there was a fourfold difference in the mean ICD implant rates for 1998 to 2002 between the UK health authorities with the lowest (Fife, Scotland: 9.2/million) and the highest (Eastern Health and Social Services Board, Northern Ireland: 39/million) activity.15 Expert commentators have pointed out that these stark differences probably stem from limited access to cardiac catheterisation laboratories or a shortage of appropriately trained electrophysiologists or device specialists in many parts of the UK.16
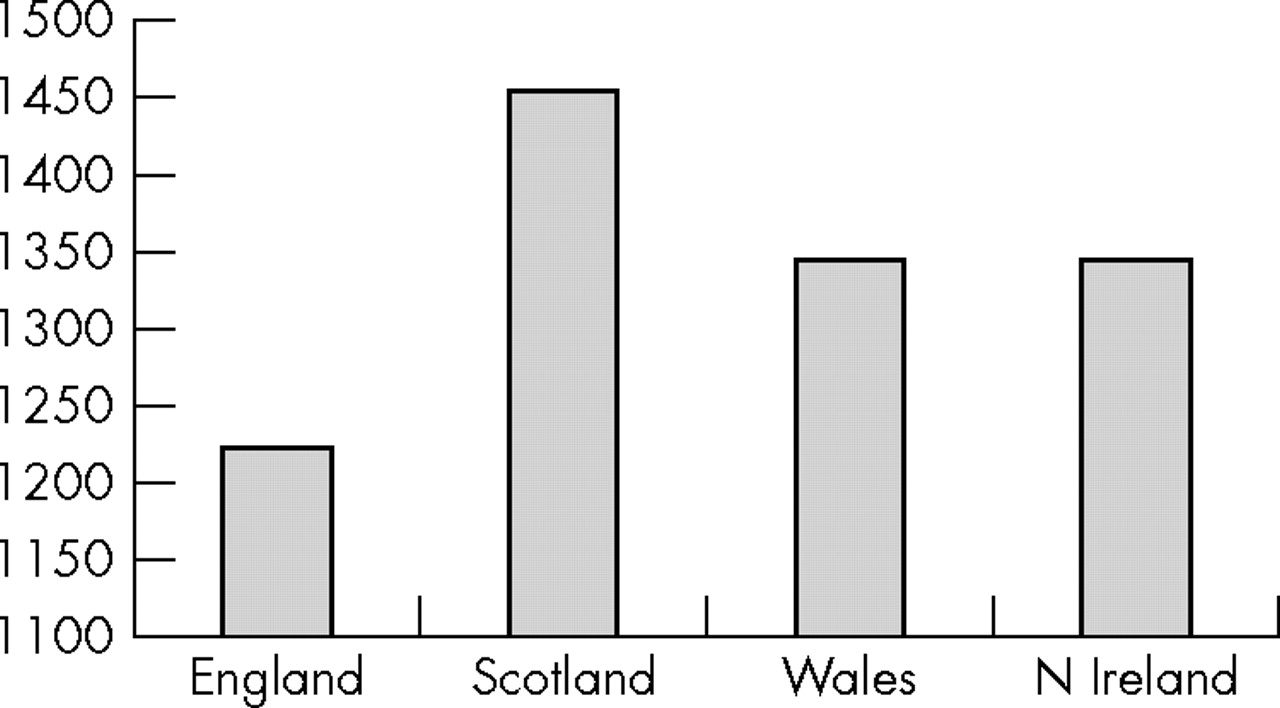
Figure 8 shows the ICD implant rates for the four home nations up to 2004. Implant rates continue to increase but there is nothing to suggest that the gap between Wales and the rest of the UK is closing.

Implantable cardioverter-defibrillator implant rates for new implants only (number per million population) by country of residence (9% of Welsh implantation procedures were done in England). Data provided by the National Pacemaker Database.12
Cardiac resynchronisation therapy
CRT is a complex form of pacemaker therapy that has been shown to improve the morbidity and mortality of selected patients with heart failure.17,18 The working group has found evidence of a very patchy uptake of this technology across the UK and believes that this reflects a shortage of the relevant expertise and difficulties in funding.
Figure 9, which was prepared with the help of the Arrhythmia Alliance, illustrates huge differences in implant rates between the four home nations. The working group has concluded that the low implant rates in Wales are due to a shortage of specialists and a lack of funding from specialist commissioners. The low rates in Scotland seem to be predominantly due to difficulties in agreeing an appropriate funding stream.

All forms of cardiac resynchronisation therapy per million population by country. The implantation rate for 2005 is a projected figure based on data for the first eight months of the year. Data include new and replacement devices and were prepared by the Arrhythmia Alliance with help from Central Cardiac Audit Database and Association of British Healthcare Industries.
CRT can be delivered by devices that provide only a pacing function (CRT-P) and those that also incorporate a defibrillator capacity (CRT-D). Interestingly, there are even larger national differences in the use of these subtypes of CRT. Thus, in 2004 the approximate rates per million population for CRT-P implants in England, Scotland, Wales and Northern Ireland were 17, 6, 4 and 12, respectively, whereas the respective rates for CRT-D were 18, 7, 3 and 32.
Echocardiography
In contrast to our first report we have tried to include non-invasive cardiac investigations as another comparator of service provision in this survey and have specifically examined echocardiography facilities, staffing and activity. Data obtained from a comprehensive postal survey of echocardiography facilities conducted by the British Society of Echocardiography are presented in figs 10–12 and table 2 and show important national differences in the provision of this vital service.
Results of the British Society for Echocardiography postal survey of UK hospitals that provide echocardiography
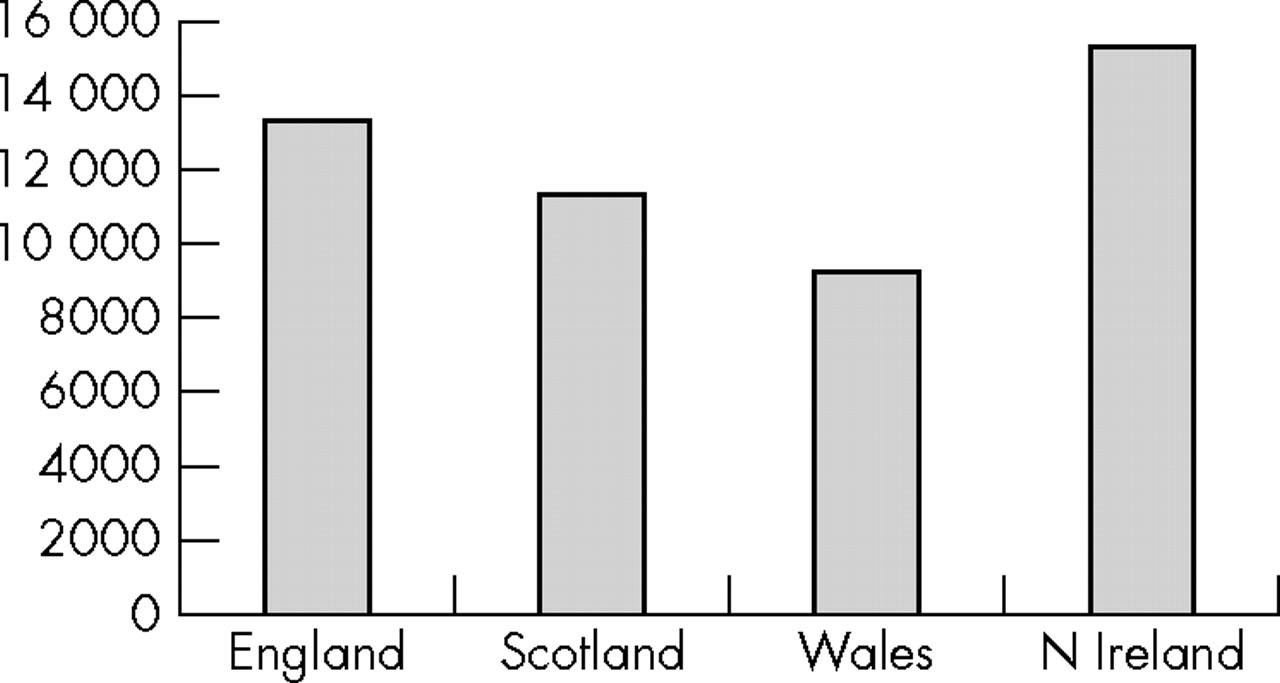
Annual number of transthoracic echocardiograms per million population by country.
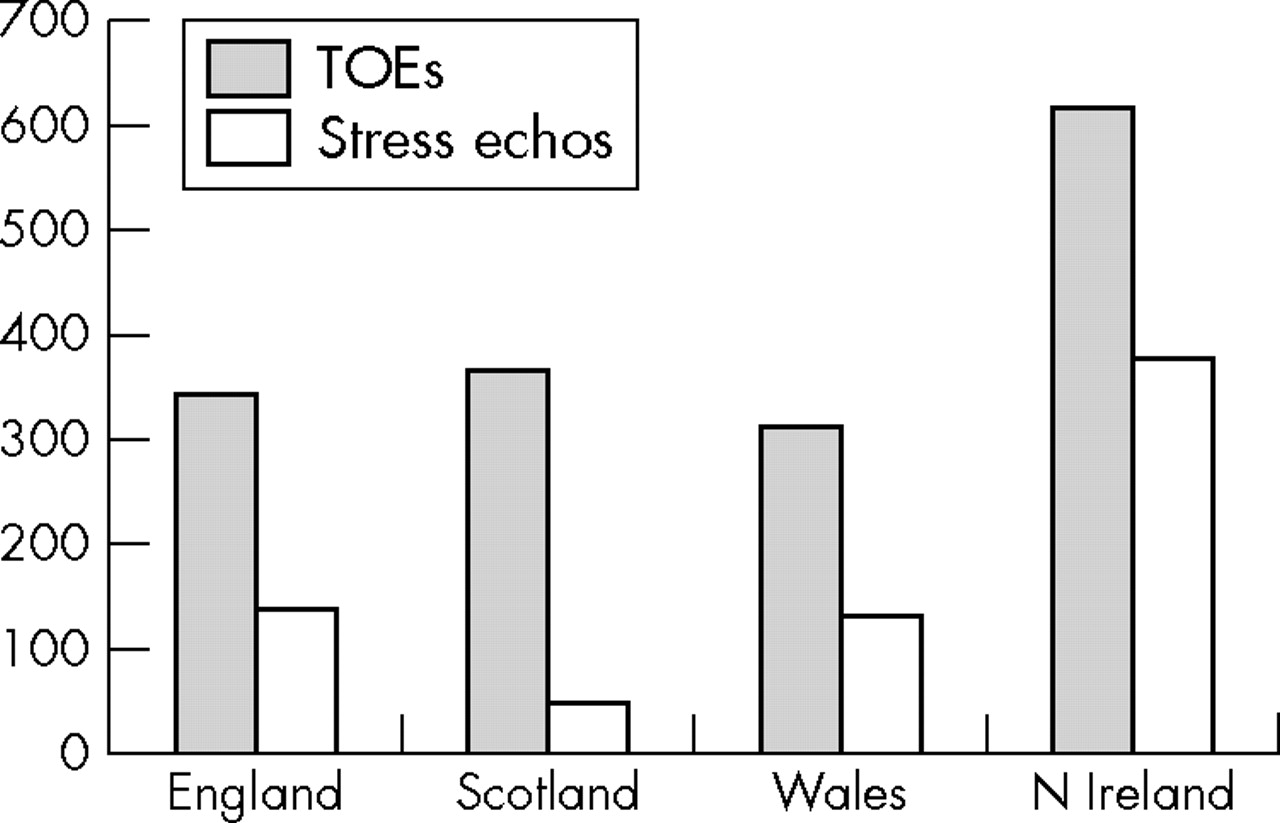
The annual number of standard transthoracic echocardiograms ranges from 9167 per million in Wales to 15 294 per million in Northern Ireland. This disparity clearly is not related to differences in need. The delivery of more complex echocardiography (transoesophageal echocardiography and stress echocardiography; fig 11) varies even more. The annual number of stress echocardiograms performed in Scotland is exceptionally low and offers another example of the slow pace at which new technology has been introduced in that region. In contrast, this sort of specialist activity is particularly high in Northern Ireland.

Annual number of transoesophageal (TOEs) and stress echocardiograms (Stress echos) per million population by country.
The number of echocardiograms carried out in each country is, not surprisingly, mirrored closely by the availability of sonographers (fig 12). Paradoxically, waiting times for transthoracic echocardiography were longest in the countries with the most sonographers and the highest throughput. Thus, 78% of units in Northern Ireland and 31% of units in England reported waiting times in excess of 18 weeks compared with 14% of the units in Wales and none of the units in Scotland (table 2). This may reflect complex differences in demand that the survey did not consider.

Number of full-time equivalent sonographers per million population by country.
Staffing problems were most evident in England, where 44% of hospitals reported the loss of one or two sonographers, and 13% the loss of more than three sonographers, within the previous two years. None of the hospitals in other countries reported the loss of more than three sonographers in the past two years, but 40% of hospitals in Wales, 33% of hospitals in Scotland and 22% of hospitals in Northern Ireland reported the loss of one or two sonographers. Agency staff were used to fill more than 25% of posts in 15% of English units and 8% of Welsh units, but none of the units in Scotland or Northern Ireland. Moreover, more than 25% of posts were unfilled by either permanent or agency staff in 22% of English units, 14% of Welsh units, 8% of Scottish units and none of the units in Northern Ireland. In addition only 58% of the sonographers working in England were fully trained specialists compared with 68% in Scotland, 91% in Wales and 100% in Northern Ireland
DISCUSSION
Most, if not all, of the national variations in the provision of cardiac services that were identified in our first report2 are still present. Moreover, there is little evidence to suggest that these differences are diminishing and some new inequalities have been identified.
This report highlights some striking disparities between spending, activity and the burden of disease, and includes many examples of the inverse care law (“the availability of good medical care tends to vary inversely with the need for it in the population served”).19,20
Cardiac services in the UK are evolving rapidly and it is perhaps not surprising that the most obvious anomalies relate to the use of emerging technologies such as drug-eluting stents, ICDs and CRT. The huge (up to 10-fold) difference in the provision of some of these services is clearly not related to need and must therefore reflect differences in clinical practice and healthcare policy. At this stage it is not clear whether devolution will lead to increasing variations in service delivery; however, characteristic strengths and weaknesses are becoming apparent in each of the four home nations.
Cardiac services in England have developed rapidly since the NSF was published and numerous benefits have been documented.21 In particular, there has been huge investment in front-line services, supported and driven by the appointment of 180 new consultant cardiologists in the past three years. A few years ago specialist activity in England was substantially lower than that in Scotland and Northern Ireland but is now at least as high as in the rest of the UK. Nevertheless, there are still many gaps in the service with many long-term consultant vacancies in the north of England and wide variations in the delivery of some services such as the provision of ICDs.15 Growing regional inequalities within England will emerge if the patchy uptake of consultant posts (particularly the high number of long-term vacancies in the north) is not dealt with. The BCS will therefore analyse in more detail the workforce survey conducted for this report.
Cardiac services in Scotland were among the best in the UK five years ago, and long-established services such as simple transthoracic echocardiography and pacing remain excellent. Unfortunately, Scotland has not achieved the same growth in consultant cardiology staffing or specialist activity as England. For example, the number of PCI procedures has risen relatively slowly and is projected to fall behind the English rate next year (fig 5); this cannot reflect differences in need because cardiovascular morbidity and mortality in Scotland remain the highest in the UK (figs 2 and 3). Moreover, drug-eluting stents, CRT and stress echocardiography have been used more sparingly in Scotland than in the rest of the UK. These procedures are supported by a strong evidence base and Mr Andy Kerr, the Scottish Health Minister, acknowledged that the system for introducing new technology needs to be reviewed when he addressed the Scottish Cardiac Society in November 2005. Plans to set up a national network to oversee the delivery of revascularisation and specialist electrophysiology services in Scotland22 were abandoned before the system had become operational and these activities are now managed by three regional planning groups. Unfortunately, regional planning in Scotland has got off to a slow start (the regional planning groups have no budget and can only make recommendations to local health boards) which may account for the failure to introduce drug-eluting stents and CRT in a timely and equitable way.
Our first report identified alarmingly low coronary intervention rates in Wales. Even allowing for the substantial number of patients who reside in North Wales but are referred to England for treatment, most forms of specialist activity in Wales remain worryingly low. There seem to be two reasons for this. Firstly, there have been difficulties in commissioning. The NSF for CHD has never been adequately funded in Wales and has become aspirational rather than pivotal in healthcare planning. Tertiary cardiac and other specialist services are commissioned nationally by Health Commission Wales; their budget has not been increased in line with the emergence of NICE-approved evidence-based technologies, and the new arrhythmia chapter to the NSF, which was introduced in England more than a year ago, is still to be approved in Wales. Secondly, the consultant cardiology workforce appears to comprise many physicians who have substantial general medical duties and relatively few specialists with skills in coronary intervention and electrophysiology. Unfortunately there seems little prospect of eliminating these inequalities in the near future.
The service in Northern Ireland is provided by a highly specialised workforce that delivers relatively high rates of complex interventional procedures (figs 5, 8 and 9) but may underperform in other areas such as simple echocardiography (table 2). There are suggestions that some aspects of the Northern Ireland cardiac services are stagnating—for example, 20% of the consultant posts have been vacant for more than three months. Certainly, the lack of an overarching strategy, which might have been provided by an NSF or equivalent document, has forced the four Health and Social Services Boards in Northern Ireland to develop services in isolation and created a form of planning blight.
The phenomenon of postcode prescribing, also known as the “postcode lottery”, has been well publicised and reflects the many variables, particularly the availability and expertise of staff, that influence small healthcare units. The regional variations in activity described in this report relate to much larger service blocks and could be construed as a “national lottery”. They are certainly more likely to reflect differences in healthcare policy and planning.
The whole purpose of devolution is to allow elected representatives to plan and implement services in accordance with local needs. While it seems inevitable that local planning will identify different priorities, and therefore create variations in service delivery, the core objectives of the NHS in the four nations have not changed and the public rightly continues to expect common standards of care across the UK. There is therefore an obvious conflict between the desire to devolve decision making and at the same time eliminate postcode prescribing.
The practice of cardiovascular medicine is supported by an extraordinarily large and robust evidence base. The optimum management of most cardiovascular disease is therefore well established. The challenge facing our devolved governments is not what to do but how to ensure that it is done; we are therefore witnessing an intriguing experiment that may provide useful insight into the impact of different healthcare policies on activity and outcome. The present government has increased healthcare spending enormously and it will be fascinating to see which policies produce the best return on this investment. The answer will become apparent only through careful audit; the BCS will therefore continue to monitor all of the parameters described in this report.
Footnotes
-
↵* Following the Annual General Meeting of the British Cardiac Society on 26 April 2006, the Society became known as the British Cardiovascular Society
-
Published Online First 12 May 2006