Article Text

Statistics from Altmetric.com
Learning objectives
Understand the physical principles and operational modalities of the various intravascular imaging techniques in clinical use.
Master the interpretation of images to distinguish various plaque components and morphologies.
Learn how and where to measure vessel diameters, areas and derived indices.
Update on key publications evaluating clinical application of intravascular ultrasound (IVUS) and optical coherence tomography (OCT), especially in the setting of stent implantation.
Know the approved indications for IVUS and OCT use on the basis of current guidelines.
Introduction
Two intracoronary imaging techniques are routinely available to complement angiography in the management of coronary artery disease, namely intravascular ultrasound (IVUS) and optical coherence tomography (OCT). The former has been in clinical use for >25 years and has directly informed the fundamentals of atherosclerotic plaque composition and arterial remodelling, as well as contemporary optimal stent implantation technique.1 ,2 The latter, introduced 10 years ago, has only been more widely adopted with the development of the frequency domain (FD)-OCT imaging, which enables complete image acquisition over a 6–10 cm segment during a 3–5 s pullback period obtaining blood clearance with the pressure injection of iodinated contrast or other crystalloids. Although OCT may be limited when visualising the full thickness of atherosclerotic plaques as a result of low penetration power, it however allows for measurements on a micron scale due to the high resolution of light.3 ,4 IVUS has greater penetration and, with the exception of dense calcific plaques, is able to display the media-to-media diameter, an important measurement to evaluate remodelling and guide vessel expansion during angioplasty.5 Both IVUS and OCT are superior to angiography for quantification of vessel dimension and thus critically helpful in guiding coronary angioplasty (percutaneous coronary intervention (PCI)) and stent implantation.6–11 Greyscale IVUS can be augmented by implementation of virtual histology (VH), which offers qualitative information on plaque components, with reasonable correlation with histology.12 More recently, near-infrared spectroscopy (NIRS) generates a chemogram that can be combined with the morphological information of IVUS to estimate the lipid and collagen content, which may be important predictors of plaque vulnerability and risk of embolisation during PCI.13 OCT outperforms IVUS in the characterisation of intraluminal features (thrombus, dissections) and the measurement of the thickness of the overlying fibroatheromatous plaques, also a potential predictor of plaque vulnerability.7
In this article, we review the physical principles underlying IVUS and OCT. We indicate how to optimise image acquisition, interpret images and perform accurate measurements. Finally, we summarise the key published literature underpinning current and potential future indications for the use of intracoronary imaging in interventional practice.
Principles, probes and technique of intracoronary imaging
Intravascular ultrasound
The received ultrasound signal is modified by the absorbing or reflecting characteristics of the tissue, generating greyscale two-dimensional cross-sectional images reflecting the composition of the various plaque elements.1 All IVUS catheters are flexible probes, with a crossing profile as small as 1.05 mm (Opticross probe, BSC, Minneapolis, USA). Clinically used IVUS transducers use either mechanical single-element rotating or solid-state electronic phased array designs. In the former, the transducer rapidly rotates to produce images with improved near-field resolution and generally higher overall quality than the solid-state phased-array probes. However, rotating designs require a driving rod along the catheter length to rotate a spinning mirror, which may result in malrotation artefacts and difficulties in crossing the lesion. With solid-state catheters, the probe can be located at the catheter tip, making them ideal for situations when the catheter cannot be advanced beyond the artery segment that needs to be imaged, such as during IVUS-guided distal re-entry during recanalisation of chronic total occlusion.14 Most rotating catheters operate at a frequency of 40–45 MHz, with newer devices claiming improved resolution using wide amplitude signals and higher frequencies. Current spatial resolution is 40–150 µm (axial) and 200–250 µm (lateral) with good penetration ability.1 ,2 It is important to ensure that the catheter is properly flushed with saline as air reflects ultrasound. All patients should be heparinised and administered intracoronary nitrates prior to introduction of the IVUS catheter over a standard 0.014-inch angioplasty guidewire, so that the transducer is located distal to the segment of interest in the vessel. Pullbacks are usually performed at a speed of 0.5–1.0 mm/s. With rotational catheters, a more accurate and constant pullback speed can be achieved by virtue of the independent imaging core being located within a stationary sheath (see table 1).
Commercially available intracoronary imaging devices available in Europe
IVUS-based tissue characterisation
In addition to the amplitude of reflected ultrasound waves, as measured by traditional greyscale IVUS, the modulation of the frequency of the backscattered ultrasound waves also contains potentially useful information regarding different tissue constituents. Algorithms using spectral analysis of both the amplitude and frequency of reflected ultrasound waves enable distinction of plaque constituents with similar echogenicity on greyscale imaging, such as calcific and fibrous components, which appear bright and homogenous; lipid, intramural haematoma and lose fibrotic tissue, which produce an echo poor signal.5 ,15 ,16
Real-Time Virtual Histology VH-IVUS (Volcano Therapeutics) and iMAP-IVUS (Boston Scientific) currently offer radiofrequency analysis for plaque characterisation.15 ,16 VH-IVUS identify necrotic cores, fibrous, fibrofatty and dense calcium in plaques. Similarly, iMAP recognises fibrotic, lipidic, necrotic and calcified tissue.5 ,6 Despite the potential added value of these approaches, considerable doubt remains on the reliability of the validation and reproducibility of these methods for plaque characterisation, with no definitive evidence of clinical benefit (see table 1), which may explain the limited use of these technologies in routine practice.17 ,18
Near-infrared spectroscopy
NIRS uses the absorbance of near-infrared light to detect and quantify cholesterol within atherosclerotic plaques (lipid-rich plaques). Images are obtained with a rapid exchange catheter (TVC Insight Catheter, Burlington, Massachusetts, USA). IVUS and NIRS images are co-registered on a dedicated console (TVC Imaging System, InfraReDx, Burlington, Massachusetts, USA) (see table 1). During an automated rotational pullback, tissue composition is assessed over 1 mm depth from the luminal surface towards the adventitia.13
NIRS data are automatically displayed as a two-dimensional ‘chemogram’, presented as a colourised ring around the IVUS image, which grades the probability of the presence of a lipid-rich plaque from red (low) to yellow (high) with the intensity of the colour reflecting the amount of cholesterol ‘detected’ in the plaque. The lipid core burden index (LCBI) can be automatically computed by dedicated software and has been histologically validated. The extent of lipid-core plaque is calculated as the maximal LCBI in each 4-mm-long segments of the analysed vessel (maxLCBI (4 mm)). Non-culprit lesions with a high LCBI were found to be highly associated to subsequent major cardiovascular events with an optimal cut-off for ‘high-risk plaques’ of maxLCBI (4 mm) ≥500.19–21 While the detection of lipid-rich plaques may have potential implications in the management of patients, definitive data are needed to support a strategy of preventive treatment of these lesions, particularly when they are not shown to cause ischaemia.
Optical coherence tomography
OCT cross-sectional image reconstruction relies on wave reflection time delay. OCT employs near-infrared light (wavelength 1300 nm) resulting in higher spatial resolution (table 1). The main limitation is lower penetration depth (1–2 mm vs 10 mm for IVUS) and the need for blood clearance from the vessel lumen during the OCT pullback since blood scatters infrared light and hinders further light propagation. Blood displacement from the vessel lumen is usually achieved through the injection of crystalloid or more commonly using iodinated contrast. The injection rate should be adjusted between 2 and 3 mL/s (small right coronary artery) and 4–6 mL/s (left coronary artery).3 ,4 As soon as the OCT ‘live view’ shows adequate blood clearance, pullback acquisition is started. In FD-OCT, that has completely replaced time-domain (TD)-OCT, all backscattered time delays are measured simultaneously and interpreted by the Fourier transformation leading to a faster image acquisition (>100 frame/s), allowing the visualisation of a long vessel segment (6–10 cm) during a single acquisition. The recommended pullback speed is 20 mm/s. Compared with TD-OCT, which has a slow image acquisition and required prolonged vessel occlusion during pullback, FD-OCT is much easier to perform, with few seconds of blood clearance sufficient for acquiring images along the entire segment of interest, minimising the complication rate.22 Renal impairment remains a limit to the employment of FD-OCT if iodinated contrast is employed for blood clearance, especially if the performance of several pullbacks is envisaged.
The OCT console provides real-time visualisation of cross-sectional and longitudinal recordings and the automatic real-time measurement of lumen area, diameters and diseased segment length, with possibility of manual correction. Immediate three-dimensional display is also possible (see table 1).23
The performance of intracoronary imaging during coronary angiography and PCI is safe. The rate of dissection and acute vessel occlusion was 0.4% in older IVUS studies, with a rate of coronary spasm of 3% in contemporary studies. A low incidence of major non-fatal complications reported for TD-OCT using the occlusion technique (1% of ventricular fibrillation and 0.6% of air embolism). The incidence of transient chest pain and/or ECG changes was 48% with TD-OCT, which has now reduced to 10% with FD-OCT.1 ,3 ,4
Image interpretation and characterisation of plaque components
Review papers coauthored by experts in intracoronary imaging have led to commonly agreed definitions for image interpretation.1–4 ,7 Because of the different response of tissue to ultrasound and light, the various components of a normal or pathological arterial wall appear different with IVUS and OCT (table 2 and figures 1⇓⇓⇓⇓⇓–7).
Comparison of IVUS and OCT in clinical practice

Optical coherence tomography (OCT)/intravascular ultrasound (IVUS) characteristics of normal and pathological vessel wall. (A, B) Intimal thickening and fibrotic eccentric plaque: IVUS (A) and OCT (B) cross section in a distal segment showing eccentric fibrosis (arrow) associated with loss of the three-layer aspect that can still be recognised in the opposite quadrants as displayed in the magnified boxes (on the right). (A) IVUS resolution does not allow to distinguish the intimal leading edge in a normal vessel, but the intimamedia complex is well delineated in the presence of intimal thickening; the external elastic membrane-media interface is best recognised with IVUS (arrow).

(A, B) Calcific plaque: at intravascular ultrasound (IVUS), calcium creates a deep acoustic shadowing that hides the underlying structures (asterisk) and hampers the delineation of the external elastic membrane (A). (B) The posterior boundary of the calcium deposit (asterisk) appears sharp and well visible with optical coherence tomography (OCT) (white arrow). As far as the calcification extending from 3 to 6 o'clock is concerned, the greater OCT resolution allow the identification of the overlying fibrous cap (thickness >200 µm) separating the deposit of calcium from the vessel lumen. The cap cannot be distinguished with IVUS. With both methods, the quantification of calcific plaque is usually reported in terms of angle or number of quadrants involved.

(A, B) Lipid plaque: optical coherence tomography (OCT) and intravascular ultrasound (IVUS)-near-infrared spectroscopy (NIRS) corresponding cross sections from the same vessel segment. The lipid component of the plaque is echo lucent (IVUS) and also appears as a low signal (low light reflection, OCT). IVUS has better penetration, therefore allowing for the delineation of the entire lipid mass (A). The NIRS chemogram is represented by a ring around the IVUS cross section with a colour range from red (no lipid) to yellow (high amount of lipid) and provides a quantification of the lipid component (lipid core burden index). OCT reveals an irregular low backscattered signal with no edges and scarce backward tissue distinction (B).

(A, B) Neointimal hyperplasia (NH): corresponding intravascular ultrasound (IVUS) and optical coherence tomography (OCT) images of a stented vessel segment 3 months after implantation of a cobalt chromium everolimus-eluting stent. IVUS can hardly distinguish between NH and blood making NH quantification less reliable. OCT is the best technique for quantifying NH and its thickness can be measured as the distance from the stent strut to the intima-blood interface (A, B).

(A, B) Dissection: corresponding intravascular ultrasound (IVUS) and optical coherence tomography (OCT) at the distal edge of a recently implanted stent. IVUS can recognise the false lumen as a blood-like signal area within the vessel wall (A white asterisks) and detect the intimal flap (white arrow) separating the two lumens. OCT shows the entry tear of the dissection (green asterisk) in a proximal cross section.
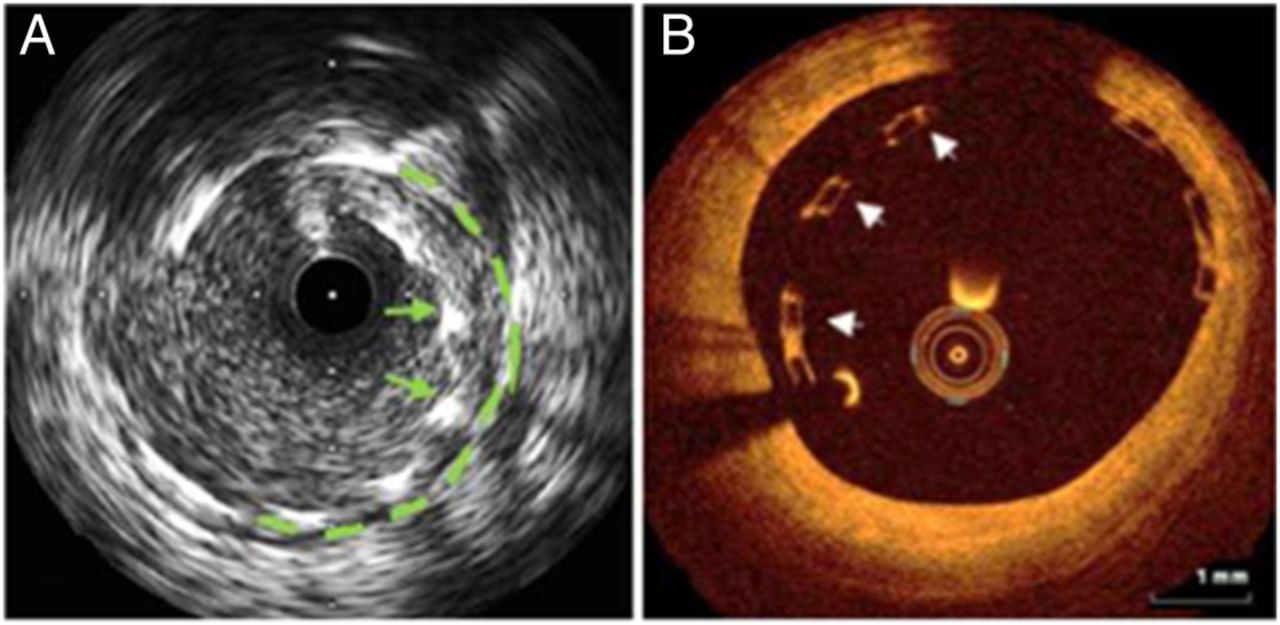
(P A, B) Stent malapposition: intravascular ultrasound (IVUS) and optical coherence tomography (OCT) images immediately after drug-eluting stent implantation in two different patients: stent struts are visible in the lumen of the vessel (A) and an echo-lucent blood-filled space separating them from the wall contour (green dotted line) can be recognised (IVUS). (B) (OCT): box-like struts of a bioresorbable stent are detected in the vessel lumen distant from the intima leading edge.

(A, B) Bifurcation: intravascular ultrasound (IVUS) and optical coherence tomography (OCT) images immediately after drug-eluting stent implantation in a bifurcation (two different patients): provisional stenting of the left anterior descending artery-first diagonal bifurcation with a single stent deployed in the main vessel. Green arrows indicate the stent strut covering the origin of the side branch (green asterisk), which appears patent in both pictures. (b1): three-dimensional rendering of OCT pullback demonstrates the stent struts overlying the vessel wall and two guidewires in the side branch, one jailed and the other used to recross into the diagonal branch (green and white arrows, respectively). (b2): two-dimensional longitudinal OCT section showing a segment of the pullback.
Normal arterial wall
Collagen is the main component that reflects ultrasound with a reflectivity 1000 times higher than the reflectivity of smooth muscle cells. As a result, the adventitia and external elastic membrane (EEM) and internal elastic membrane (IEM), rich in collagen and elastin, appear highly echogenic (white or bright) while the media layer is echo lucent (black or dark); the scarce reflectivity of the media further enhances the external elastic lamina, at the interface between hypoechoic media and hyperechoic adventitia. IVUS cannot distinguish the thin intima from the media (50–70 µm) but, when the intima thickens with increasing age, above the IVUS detection limit, a three-layered ‘target’ image develops.5 The higher spatial resolution of OCT allows the identification of the signal-poor media and a three-layer appearance can be detected in normal arterial segments. However, when the intima exceeds a threshold thickness variable according to the absorption coefficient of the prevalent plaque component, the EEM and the adventitia (signal-rich outer layer) cannot be delineated and the media-to-media diameter cannot be measured (figure 1 A, B).1 ,15
Calcium
Ultrasound is reflected by calcium plates and a bright signal with acoustic shadowing is the characteristic of macrocalcification. IVUS cannot quantify calcium volume but can assess its location in the plaque (subintimal or deeper) and measure the calcium arc. The backscattering of light through calcium, on the contrary, is low and its penetration high. This allows the identification of calcium as a signal-poor zone with a well-defined external boundary that permits the measurement of calcium thickness. OCT can highlight microcalcifications, while IVUS cannot, but OCT may miss deep calcific deposits (figure 2A, B).1–4
Lipids and lipid-rich plaques
Sound and light have completely different behaviours in lipid-rich plaques, with IVUS showing low echo intensity and good penetration, OCT low signal but very poor penetration with an indistinct external contour. This last feature allows the differentiation between the signal-poor zones occupied by lipids or calcium. IVUS has limitations in the distinction of a lipid-rich plaque/necrotic zone from other superficial echo-lucent (dark) components such as intramural haemorrhage, thrombus and intimal hyperplasia. The main advantage of OCT in the study of lipid-rich plaques is that it can measure the thickness of the fibrous cap, with values of <70 µm (or <85 µm in three contiguous frames) often considered at risk of rupture.4 ,24 ,25 Pathology studies suggest a lower cut-off measurement of 65 µm, but the consensus among scholars of OCT was to set the threshold higher taking into account the axial resolution of OCT and the shrinkage induced by the tissue fixation during preparation for histology. OCT occasionally detects cholesterol crystals as thin linear high-backscattering elements, and macrophage infiltration, displayed as bright subintimal lines with shadowing behind.26 The sensitivity and specificity of OCT in the identification of fibroatheromas is far from perfect, hampered also by the low penetration that may prevent visualisation of deep lipid components. In vitro and in vivo validation is excellent for NIRS, which can be considered the gold standard for identification of lipids with intracoronary imaging.13
Clinically relevant advanced atherosclerotic plaques, type IV–VI American Heart Association (AHA) classification include a combination of lipid, fibrous tissue and calcium resulting in a mixed echogenicity/signal intensity.27 They are often described, based on their prevalent component, as ‘fibrocalcific’ or ‘fibrofatty’ (figure 3A, B).1 ,3
Thrombus
This is displayed as an intraluminal mass, layered or lobulated and protruding. At IVUS, it appears as an echo lucent mass possibly attached to a plaque with or without signs of cap rupture. The detection of small thrombi in segments with stagnant blood requires blood clearing by the injection of saline or contrast. Thrombus identification by OCT is easier and more trustworthy and the differentiation between red (red blood cell-rich) and white (platelet-rich) thrombus is also possible. The first one behaves similarly to blood and has high-medium reflectivity with high light attenuation, while the second has less backscattering with low attenuation capacity and greater homogeneity.1–4
Dissection
IVUS classification proposed by the expert 2001 American College of Cardiology Clinical Expert Consensus Document on IVUS has been endorsed by the American College of Cardiology Consensus Standards for intravascular OCT in 2012.
Briefly, dissections are divided into five types. A dissection is ‘intimal’ when limited to the intima or atheroma; ‘medial’ when the dissection rim extends into the media and ‘adventitial’ when the flap reaches the EEM. In addition, ‘intramural haematoma’ is described as an accumulation of blood or dye within the medial layer, displacing the internal and external elastic membranes; entry and/or exit points may or may not be identified (figure 4A, B). Finally, an ‘intra-stent’ dissection consists in the separation of the neointima from the stent struts.1–4 The higher OCT resolution improves the accuracy in the diagnosis of dissections, as confirmed by the Optical Coherence Tomography vs Intravascular Ultrasound (OCTIVUS) study, which showed a significantly lower yield for diagnosis of edge dissections with IVUS (percentage agreement among observers 34.3%) compared with OCT (58.2%, p<0.0001).28
Intimal hyperplasia
In early in-stent restenosis, neointimal hyperplasia has great cellularity and low echogenicity, hardly distinguished from blood. Late in-stent intima proliferation gives a more intense signal at IVUS. OCT clearly detects intima proliferation as a high backscattered thick layer facing the lumen, surrounded by the intensely reflective stent struts. Histological variations within the neointima result in a complex classification of its appearance (homogeneous or heterogeneous) (figure 5A, B).7 ,11
Stent strut
By IVUS and OCT, metal stent struts are highly visible but the appearance by IVUS is often blurred by side lobes and other artefacts, making the assessment of small malappositions difficult. The resolution of IVUS also prevents the detection of the thin layer of intimal hyperplasia (on average, 50–70 µm) that develops in modern drug-eluting stents (DESs). With OCT, stents appear as highly backscattering (OCT) points or arcs (depending on the stent design) that lead to specular reflection of the signal producing a shadow behind and a ‘blooming’ artefact so that the strut width and thickness cannot be measured. Still knowing the type of the stent implanted and the thickness of its struts and detecting the wall immediately adjacent to the posterior shadow allows detection and quantitative assessment of even the smallest malapposition (figure 1).6 ,7 ,10
Compared with IVUS, OCT has far greater sensitivity for the detection of dissections at the stent edges, tissue protrusion and stent malapposition, but the clinical relevance of these findings needs further evaluation in properly designed studies. As far as novel bioresorbable stents are concerned, ultrasound crosses the scaffold with only mild reflection and no acoustic shadowing and the struts appear as moderately echogenic lines. With OCT, the polymeric scaffold is perfectly outlined as box-like structures, with no shadowing, and its changes over time in the period of bioabsorption can be assessed.29 ,30
OCT has offered new insights into the mechanism of late stent failure. In particular, OCT has become the gold standard for the evaluation of angiographically confirmed stent thrombosis, identifying the mechanism underlying stent failure in most cases. Late and very late stent thrombosis were mainly related to stent malapposition (31%) with growing evidence of acute occlusions developing years post-implantation of a potential role of neoatherosclerotic changes (28%).31 IVUS has lower sensitivity for the detection of thrombus and also VH has difficulties to identify the small superficial lipid pools inside restenotic plaques because of the technical artefacts in the ring-down subtraction.
Essential IVUS-OCT measurements
Calibration is not required for IVUS, which applies algorithms based on the known speed of sound in tissue. OCT requires calibration and the measurement accuracy is improved if calibration is repeated at the level where the measurement is performed.
Lumen areas and diameters, directly measured as maximal and minimal diameter or derived as mean diameter from the area measurement, can be obtained both by IVUS and OCT (table 2). OCT has the advantage of creating a sharp interface between the lumen, where the blood is replaced by crystalloids, and the intima, amenable to automatic tracking with great accuracy if the blood clearance has been adequate.5 ,23 The identification of the lumen contours is always more demanding with IVUS and requires greater experience, with potential significant misinterpretations in the context of slow flow and/or plaque components with low echogenicity. The 2014 European Society of Cardiology (ESC) guidelines on Myocardial Revascularisation define IVUS as the ‘established standard for accurate measurement of plaque burden’, while OCT is proposed as the ideal tool for the identification of intraluminal components, assessment of stent implantation and for the evaluation of strut coverage and neointimal thickness at follow-up.32 We report here the principal quantitative measurements that, unless otherwise specified, apply both to IVUS and OCT and should be performed in frames free from artefacts.1–4 ,7
Proximal and distal reference segments
These are vessel segments adjacent to the stenotic segment characterised by a large stable lumen area, proximal and distal to the stenosis. Ideally reference segments are supposed not to have a >40–50% plaque burden. In diffusely diseased vessels, the ideal reference can be considered as the optimal point where the stent edge should be located. After stenting, the definition of the reference is more straightforward, usually within 5 mm from the stent edges. Occasionally (ostial lesions, proximal or distal bifurcations), the proximal or distal reference cannot be identified (figure 8).

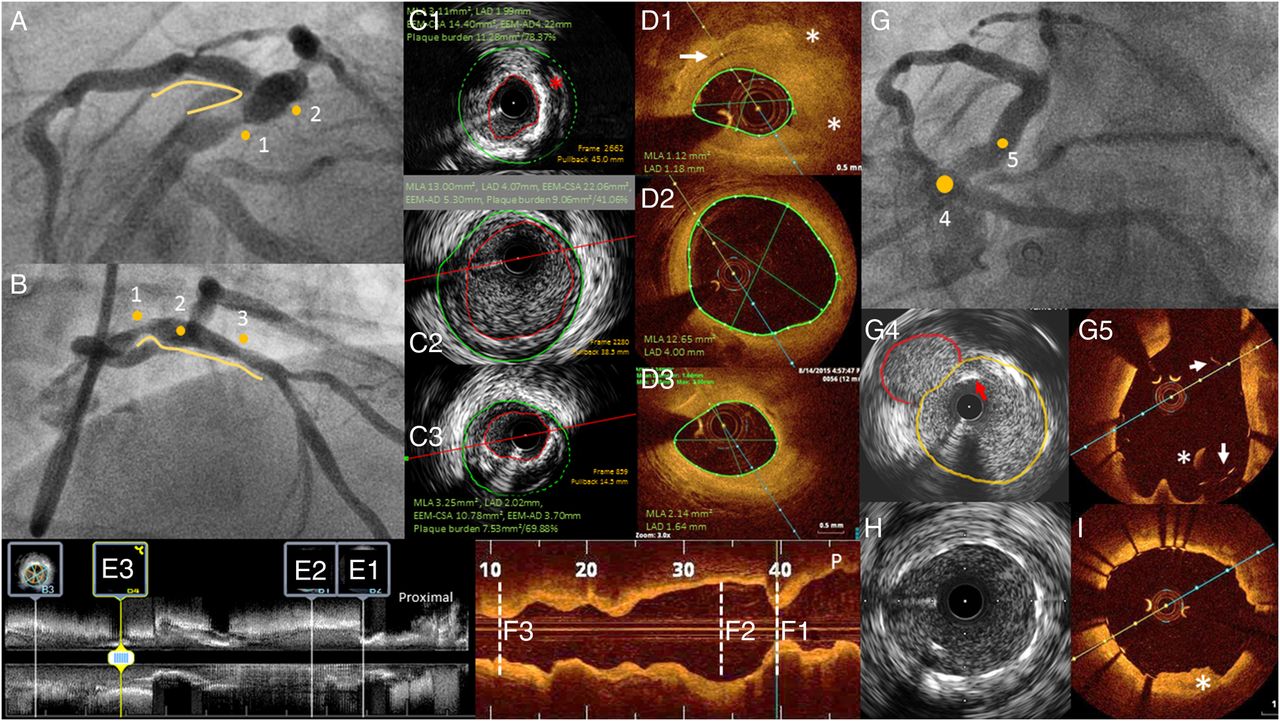
Intravascular ultrasound (IVUS) and optical coherence tomography (OCT) performed during urgent percutaneous coronary intervention (PCI) for non-ST elevation myocardial infarction, before and after stenting. (A, B) Coronary angiography showing critical proximal left anterior descending coronary artery (LAD) stenosis (1) and severe mid LAD stenosis (3) with ectatic vessel in between (2), in the spider and right anterior oblique (RAO) cranial view, respectively. (C1 and D1) Minimal lumen cross-sectional area (MLCSA) and mix plaque: MLCSA as measured by IVUS and OCT, respectively. Calcium appears as a bright layer producing acoustic shadowing (1st, 2nd and 4th quadrant) with IVUS: an echolucent area suggestive of a lipid component can also be observed (red asterisk). OCT detects a thick fibrous plaque (high backscattering) including an intimal channel consistent with neorevascularisation (white arrow); deeper calcium and lipid deposits can be seen as low signal tissue with a sharp external edge (calcium) and low signal area with a hazy external border (lipid). OCT allows the automatic and reliable tracing of the lumen area. IVUS also provides the plaque burden, 71% in this lesion. Panels E1 and F1 represent the MLCSA as visualised in the longitudinal vessel view, which allows the measurement of lesion length. Panels C2, D2, E2 and F2: reference-CSA, distal to the critical stenosis. Panels C3, D3, E3 and F3: CSA at the level of the severe mid LAD stenosis. (G) Post-PCI coronary angiography showing good expansion and apposition of the stents. G4 and G5: separate origin of the LAD and the left circumflex coronary arteries directly from the aorta. IVUS (G4) can visualise the entire vessel contour of both the LAD (yellow line) and left circumflex (red line). IVUS pullback showed the absence of the left main artery with the two vessels originating separately from the left Valsalva sinus with an initial parallel course, mistaken as a possible left main coronary artery at angiography. OCT (G5) cannot visualise the entire profile of the circumflex (too large). Both techniques highlight the presence of a few stent struts protruding into the aorta (red and white arrows). The white asterisk marks a blood artefact in the OCT image. (H, I) Well-expanded metal stent with no strut separated from the blood-intima interface, as outlined by OCT. In (I), tissue prolapse is recognised (white asterisk), while no clear-cut similar structures are identifiable in the corresponding IVUS frame.
Minimum lumen cross-sectional area and diameter (MLCSA and MLD)
The minimum area is measured at the level of the most narrowed vessel segment and the minimum and maximal diameters are obtained connecting two opposite points of the blood-lumen leading edge interface passing through the centre of the vessel (not the probe centre). The identification of the minimal lumen cross-sectional area (MLCSA) is almost impossible without a mechanical pullback with a sufficient number of cross sections per millimetre. Usually, these measurements are more accurate when performed by OCT.
Lumen eccentricity
It is the ratio between the difference of maximum and minimum lumen diameter and the maximum lumen diameter.
Lumen area stenosis (%)
This is the ratio between the difference of the reference cross-sectional area (CSA) and the MLCSA, divided by the reference CSA; it is important to specify whether the reference CSA employed is the proximal, distal or, as often requested, an average of the two (figure 8).
EEM-CSA and media-to-media diameter
These measurements, occasionally referred also as vessel area and diameter, are normally reserved for IVUS. In around 50% of cases, however, the EEM diameters can be measured with OCT in a distal normal reference segment. In the presence of extensive calcification determining acoustic shadowing (>90° of vessel circumference)1 and sometimes after stent implantation, IVUS also cannot precisely track the course of the EEM.
(Atheroma) Plaque-CSA and (atheroma) plaque burden
Since the media cannot be clearly identified by ultrasound, the intimamedia complex is used for the calculation of the plaque burden (EEM-CSA minus lumen-CSA and divided by EEM-CSA and expressed as a percentage).
Remodelling
This is the ratio between the EEM-CSA at the level of the lesion and the reference EEM-CSA. This index can be calculated almost exclusively with IVUS, with positive remodelling (lesion EEM-CSA >110% of reference CSA) more often observed in unstable lesions and negative remodelling (<90%) in stable fibrotic lesions and chronic coronary occlusions.33
Length of diseased segment in need for coverage
The automated pullback within a stationary sheath, possible with OCT or mechanical IVUS, allows the accurate measurements of the length of the diseased segment in need of treatment.23
Quantitative assessment within stents
Especially late after stent implantation when intimal hyperplasia develops, one additional area can be added drawing a line connecting the stent struts. The difference between stent-CSA and lumen area (neointimal hyperplasia) divided by the stent-CSA identifies the percentage of in-stent stenosis. The superior resolution of OCT allows the individual measurement strut-by-strut of the distance of the leading strut edge from the wall, with the difference between this distance and the known strut thickness measuring the distance between strut and intima/lumen interface. Stent expansion is usually evaluated based on the comparison between minimal stent-CSA and reference lumen area but a small absolute minimal stent area is also correlated with late adverse events and comparisons taking into account the reference vessel area having also been proposed.6 ,34
Dedicated IVUS and OCT postprocessing software implemented on most commercial consoles allow for three-dimensional rendering of the examined vessel. Geometrically corrected three-dimensional rendering requires fusion with biplane angiography and can be of particular interest in bifurcations.35–39
One of the newest and most practical developments in intravascular imaging is the ability to identify in the angiographic images start and end of the pullback, allowing appropriate software to co-register OCT or IVUS and angiography. The information obtained has particular interest to improve the accuracy of stent implantation, both in terms of stent positioning and selection of stent length.40
The crisp images provided by OCT lend themselves to the automatic identification of the lumen-wall interface with direct measurement of lumen areas and derived diameters in all cross sections. The automatic detection of the stent strut has also demonstrated high accuracy, allowing the application of dedicated programs to quantify stent malapposition (distance strut-wall) and neointimal coverage. These novel techniques can simplify stent strut analysis either in clinical or research applications.41 ,42
Results of clinical studies
In spite of widespread experience with intracoronary imaging, especially IVUS, there is no definitive evidence that either systematic IVUS or OCT confers clinical benefit. Several applications of intracoronary imaging, such as assessment of haemodynamic significance of stenosis, have been recently challenged. The prognostic value of increased plaque burden associated with other high-risk characteristics in non-functionally significant stenosis remains highly controversial, but both clinical trials and prospective registries have started addressing the predictive value and the usefulness of modifying the interventional strategy based on the IVUS and OCT findings. The reduction of adverse events and stent thrombosis after stenting has been confirmed in recent small randomised studies and large registries, as acknowledged in recent guidelines.32
Functional lesion assessment by IVUS and OCT
General recommendation
Two-dimensional IVUS/OCT assessment should not be routinely used for the assessment of haemodynamic significance of lesions. IVUS and OCT qualitative and quantitative parameters do not provide functional information. The correlation between MLCSA, minimal lumen diameter (MLD) and other parameters with fractional flow reserve (FFR) has indeed revealed to be inconclusive32 ,43–71 (table 3 and figure 9). In particular, the old criteria of using a cut-off of 4.0 mm2 for proximal epicardial arteries and 6.0 mm2 for LM lesions have been challenged by multiple studies comparing IVUS results with FFR or clinical outcome. Because of the known limitations of FFR in the assessment of LM lesions in the presence of other lesions in left anterior descending coronary artery (LAD) and left circumflex artery (LCx), IVUS is still widely adopted, also because of the advantages offered in the optimisation of stent implantation. The most widely accepted cut-off, however, has been reduced to 4.5 mm2.44
List of studies comparing IVUS and/or OCT parameters to FFR ischaemic threshold and summary of main findings
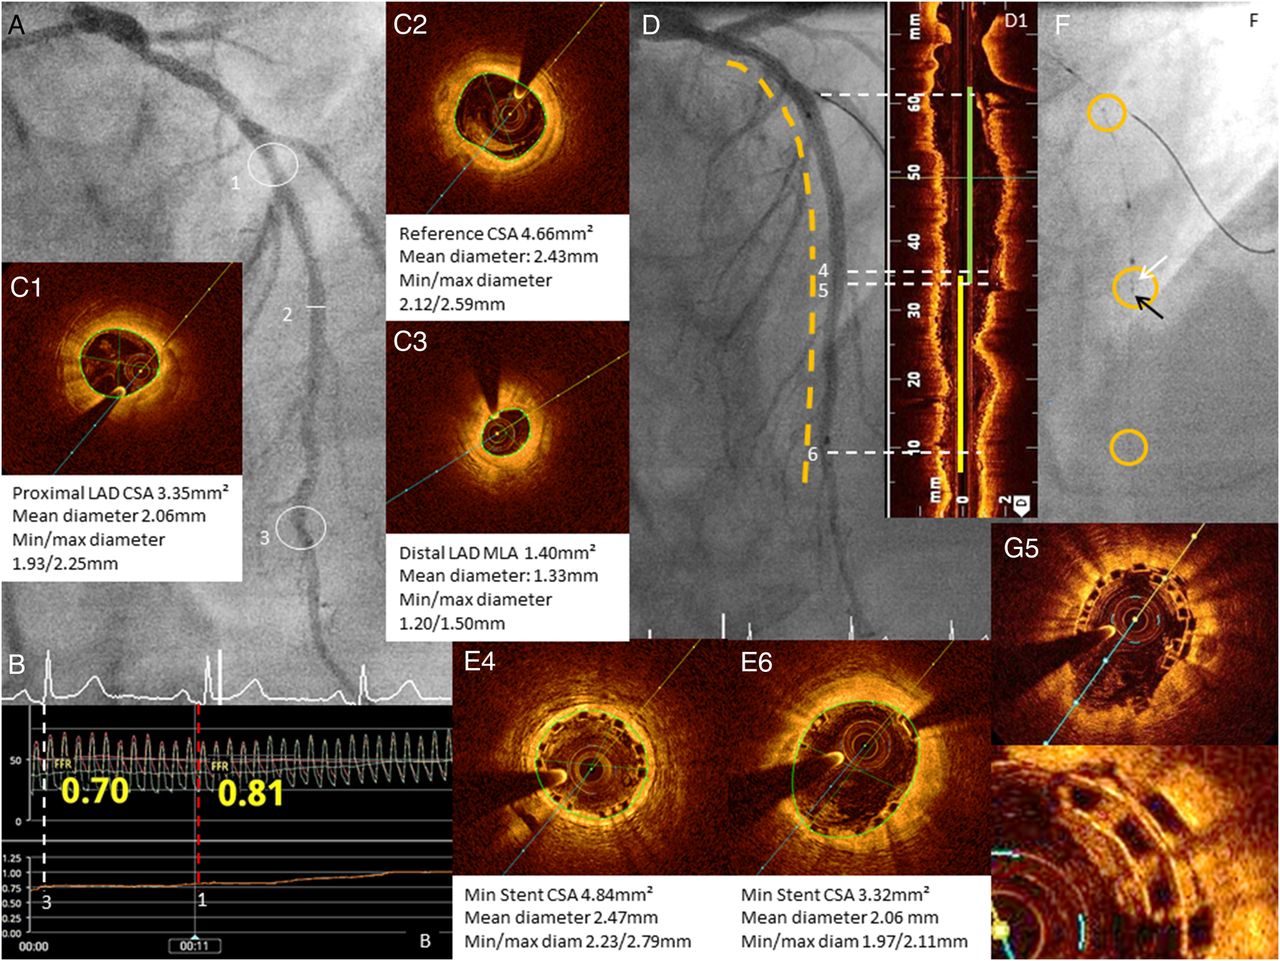
Fractional flow reserve (FFR) measurement and optical coherence tomography (OCT) image in a patient with angiographically intermediate left anterior descending coronary artery (LAD) stenosis. (A) Diagnostic coronary angiography showing proximal (A1) and distal (A3) moderate LAD stenosis (visual estimation 40% and 60%, respectively) in the context of mild–moderate diffuse disease. (B) FFR demonstrated the haemodynamic significance of the distal stenosis (B3, 0.70), while the FFR beyond the proximal lesion resulted borderline (B1, 0.81). OCT showed diffuse calcific and fibro-lipidic plaques with a severely reduced proximal cross-sectional area (CSA) (2.97 mm2, C1) and a second important lumen reduction at the level of the distal stenosis (1.40 mm2, C3). The reference lumen CSA (A2 and C2) was measured proximally to the first diagonal due to the diffuse disease in the remaining segments. (D) The angiographic result after stent implantation. D1: the OCT longitudinal reconstruction allowed the precise measurement of the total vessel length in need of stenting and the anatomical landmarks visible also with angiography for the implantation. Panels E4 and E6 show the result after the deployment of two bioresorbable (BVS) everolimus-eluting stents (2.25×28 mm distal and 3.0×28 mm in the mid LAD). The OCT pullback highlights the poor expansion of the distal stent, corrected with postdilatation to very high pressure (40 atm) with an OPN non-compliant balloon with optimal final result. (F) The distal bioresorbable vascular scaffold (BVS) proximal marker (black arrow) and the proximal BVS distal marker (white arrow) are used during implantation to minimise superimposition. D5 and G5: OCT cross section of stents overlap (0.8 mm at the longitudinal view).
IVUS cut-off should not be employed with OCT, which usually gives lower diameter and area results because of better intima delineation.23 ,62 ,65 ,66 ,70 ,71
A recent meta-analysis concluded that IVUS and OCT have moderate diagnostic accuracy for recognising haemodynamically significant stenosis and only a left main IVUS-MLCSA >5.4 mm2 predicts normal FFR accurately.53 ,64 ,67–70
Volumetric analysis of IVUS and OCT data has the potential to improve functional significance of lesions.72
Stent implantation and follow-up
OCT and IVUS are invaluable tools to facilitate real-time planning of PCI by defining plaque composition, lesion severity and length, bifurcation involvement and enabling the direct measurement of reference segment dimensions. These modalities inform lesion preparation and stent sizing (table 4).7 ,73–82
International guideline recommendations for the use of IVUS and OCT during coronary angiography and percutaneous revascularisation
The poststent implantation pullback permits judging of the provisional result, the need for further optimisation or may guide recrossing into a side branch.83 Both IVUS and OCT can show the mechanism underlying in-stent restenosis and thrombosis (strut underexpansion/malapposition, tissue prolapse and edge dissection). However, the mid-term and long-term prognostic implication of these findings by either IVUS or OCT remains uncertain.80
In the bare metal stent era, controversial results were obtained in large randomised trials focusing on the prevention of restenosis, with some evidence of efficacy in complex lesions and small vessels (angiography versus intravascular ultrasound-directed bare-metal coronary stent placement (AVID), OPTimization with ICUS to reduce stent restenosis (OPTICUS), Can Routine Ultrasound Influence Stent Expansion (CRUISE)).75 ,84 ,85
IVUS-measured minimum stent-CSA after both bare-metal stent (BMS) and paclitaxel-DES implantation revealed an independent predictor of 9-month stent patency (cut-off value of 5.7 mm2 for paclitaxel-DES and 6.4 mm2 for BMS).34
The first convincing evidence of improved outcome of patients with IVUS-guided stent implantation came from a Korean registry of left main treatment.86 A substudy of the MATRIX registry expanded this observation to patients with second-generation DES.81 In a 2012 meta-analysis, IVUS-guided DES delivery was associated with lower mortality rate, major adverse cardiovascular event (MACE) and stent thrombosis compared with angiography-guided DES implantation. The only very small randomised trial in the DES era failed to prove prognostic benefit in the IVUS arm.73
OCT has several advantages compared with IVUS, including the automatic real-time tracking and measurements of diameters and areas (measured at the lumen level) leading to rapid detection of MLCSA and reference-CSA, the accurate visualisation of stent malapposition, edge dissection and tissue prolapse prompting additional stent optimisation.87 In the Centro per la Lotta contro l'Infarto-Optimisation of Percutaneous Coronary Intervention (CLI-OPCI) study, FD-OCT detected edge dissection (14%), lumen narrowing (3%), stent underexpansion/malapposition (41%) and thrombus formation (22%), which were otherwise undetected by angiography alone. This in turn led to additional contextual interventions in 35% of patients compared with the angiography-guided PCI group. Usage of OCT resulted in lower risk of death and myocardial infarction (MI) even after one extensive regression analysis. However due to its non-randomised nature, the results of the CLI-OPCI study must be interpreted carefully.78 The ILUMIEN I trial prospectively acquired pre-FFR and post-FFR and OCT in 418 patients with stable or unstable angina or non-ST elevation myocardial infarction (NSTEMI) undergoing elective PCI. The OCT study before PCI modified the PCI strategy in 55% of patients (57% of stenoses), mainly inducing corrections in the angiographically selected stent length. Post-PCI OCT, performed in 98% of cases after angiographic and FFR optimisation, detected malapposition in 14.5% of cases, underexpansion in 7.6% and edge dissection in 2.7%, promoting further optimisation in 27% of cases.10 Compared with IVUS, OCT reveals a higher prevalence of tissue protrusion, baseline and late stent malapposition and neointimal hyperplasia.8 ,88 The underlying mechanisms of stent thrombosis were analysed in the CLI-THRO study. Twenty-one patients undergoing emergency treatment of angiographically demonstrated stent thrombosis underwent OCT revealing no optimal stent deployment in 95% of patients with higher incidence of stent under expansion and edge dissection.89
OCT-guided PCI versus IVUS-guided PCI were compared in a retrospective study (ILUMIEN II trial). A higher prevalence of post-PCI stent malapposition, tissue protrusion and edge dissections was detected by OCT.88
Other ongoing trials aimed at the comparison of OCT and IVUS for guidance of stent implantation include the OPINION and ILUMIEN III studies.90 ,91 The ILUMIEN III study will enrol 420 patients and focus on superiority/non-inferiority of postprocedural in-stent MLCSA after OCT and IVUS. The OPINION study will assess stent failure at 9 months, with an angiographic restudy of all patients. Preliminary postprocedural results reported after completion of the enrolment of 829 patients showed a borderline significant lower MLCSA in the OCT-guided group and a significantly lower in-stent acute lumen gain (1.63 OCT vs 1.75 mm IVUS, p=0.003).
In the era of new BVS-DES, OCT and IVUS have been employed to study the process of strut reabsorption over time, neointimal coverage, late lumen loss29 ,92 ,93 and vessel remodelling after BVS performance compared with second-generation DES.92
OCT has a shorter learning curve and low intraobserver and interobserver variability, which make it a valid clinical and research tool in the setting of intracoronary stent imaging.87 Nonetheless, in experienced hands, IVUS is an adequate guide and standards for optimisation of stent implantation have been proposed.6 ,82
IVUS may be helpful in chronic total occlusion (CTO)-PCI for stent selection, ensuring lesion coverage and stent optimisation. IVUS-guided PCI of CTO was associated with a significantly lower MACE rate during the 12-month follow-up and high-pressure poststent ballooning compared with angiographic-guided group (CTO-IVUS study).94 IVUS can also evaluate vein grafts, another area that gives us further insight into the process of atherosclerosis, therefore anticipating graft occlusion.37 ,95
Trials in acute coronary syndrome
Intracoronary imaging has provided insight into the identification of culprit lesions and the mechanisms underlying plaque destabilisation in acute coronary syndrome (ACS). This principally involves evaluation of plaque morphology, composition and integrity/thickness of fibrous cap and presence of thrombus. Prognostication of lesions for their risk of future ACS is an area of active investigation.
Thin cap fibroatheroma (TCFA), which is the most commonly identified lesion morphology in observed histopathological analyses of patients having sudden cardiac death presumed secondary to ACS, cannot be accurately identified by IVUS, though plaques with hypo-echoic regions that are in direct continuity with the lumen are considered the equivalent of histological lipid rich-TCFA.96 OCT currently has an unrivalled capability for detecting and measuring the thickness of the atheroma fibrous cap and has greater sensitivity for the detection of plaque rupture (73% vs 40%), erosion (23% vs 0%) and thrombosis (100% vs 33%) compared with IVUS.97 In 83 patients with NSTEMI, an OCT-detected TCFA was more frequent in patients developing no-reflow (Thrombolysis in Myocardial Infarction (TIMI) 0–2), but only the lipid arc was an independent predictor of this phenomenon. OCT has thus provided an important perspective on the differing morphological features of plaques among the ACS spectrum at the culprit lesion level as well as in non-culprit segments/vessels and their healing over time.98
Prognostic value of qualitative and quantitative plaque assessment
Greyscale IVUS has intrinsic limitations when interpreting low echogenic tissue and beyond calcifications. IVUS plaque analysis revealed limited correlation with long-term prognosis.39 ,99 ,100 The PROSPECT trial enrolled 697 ACS patients undergoing three-vessel IVUS after successful PCI of the culprit lesion. The detection of TCFA was a poor predictor of late events at a median follow-up of 3 years (only 4.9% of TCFA lesions showed late events vs 1.3% for lesions without TCFA, highly significant statistically (p<0.0001) but obviously insufficient to justify additional interventional treatment of those lesions). Results support the criticisms raised by Nissen and many others on the reliability of the validation and clinical studies with VH.101 A combination of a plaque burden > 70%, TCFA detected by VH-IVUS and multivariable analysis (MLA) ≤4.0 mm2 were found to be better predictors of lesion level events (18.2% vs 1.9%, HR 11.05 (CI 4.39 to 27.82), p<0.0001).18 VH-IVUS due to its low axial resolution cannot measure the thickness of fibrous cap of TCFA. Indeed, the concept of VH-TCFA was introduced to overcome that limitation. VH-TCFA are vulnerable plaques defined by a focal, necrotic core-containing (≥10% of the total plaque area) in direct contact with the lumen and in the presence of a per cent atheroma volume ≥40%.
NIRS-LCBI has obtained encouraging results in terms of peri-PCI MI, MACE and mortality prediction irrespective of whether the patient had stable or ACS at baseline.19 ,20 LCBI could discriminate culprit from non-culprit plaques in the culprit artery and has revealed a useful tool in monitoring statin-related plaque changes.102 ,103
The advent of OCT was hailed as a promising tool for the in vivo detection of the ‘vulnerable plaque’ (prone to rupture) and risk stratification, and data suggest that a ruptured plaque underlying ACS represents an independent predictor of 6-month MACE104 and that the OCT-lipid arc angle independently predicted no reflow.24 ,105 ,106
Large plaque burden and low local endothelium shear stress were found to be independent and additive prediction factors to identify plaques that develop progressive enlargement and lumen narrowing at 6–10 months follow-up (Prediction of Progression of Coronary Artery Disease and Clinical Outcome Using Vascular Profiling of Shear Stress and Wall Morphology (PREDICTION) study).107
To date, no intracoronary imaging technique is considered the ‘gold standard’ with both IVUS and OCT proving helpful in diagnosis and guiding decision-making. Their respective use will depend on hospital availability (usually based on cost) and operator's preference and experience (table 4). IVUS properties favour its use in the evaluation and treatment of LM.1–4 ,8 ,32 The most recent BCIS audit data indicate a progressive increase in the use of IVUS in the UK, with >10% of de novo interventions using this technology, now available in >80% of the catheterisation laboratories performing PCI in the UK. Still the absolute number of IVUS studies is limited to 7618 (∼8%) of all the 91 295 PCIs performed in the UK in the same year. For OCT, numbers are much lower, with only 977 studies performed over the same period despite availability of OCT claimed in almost 50% of catheterisation laboratories. Costs and time are often quoted as the main factors explaining the low penetration of intracoronary imaging in everyday practice, but difficulties/inexperience preparing IVUS/OCT catheters, acquiring the pullbacks and interpreting the images are equally or possibly more important causes.108
Other applications
IVUS and OCT have been employed for the diagnosis of non-atherosclerotic coronary artery diseases, providing information that influences management and defines prognosis. Both techniques are useful to confirm the diagnosis of spontaneous coronary artery dissection, particularly types II and III, which cannot be established by angiography alone.109 IVUS and OCT allow early recognition of cardiac allograft vasculopathy and help prognostic stratification.1 ,5 ,110 IVUS and OCT are the only in vivo techniques able to determine the nature of the arterial dilatation, therefore discriminating between true aneurysms and pseudoaneurysms.111 The inflammatory changes post Kawasaki have been shown to promote early atherosclerotic changes.112 ,113 Finally, IVUS offers cross-sectional images of coronary arteries with anomalous origin/course or of the LM compressed by dilatation of the pulmonary trunk in pulmonary hypertension and their possible implications in impairing myocardial perfusion.114
Conclusions and future perspectives
This technical review does not pretend to substitute the indications of the current guidelines for the use of intracoronary imaging. In principle, every patient scheduled for intervention would benefit from intracoronary imaging with an extremely low risk of additional complications. Time and cost are the limiting factors and suggest focusing on interventions of greater complexity when the angiographic estimation of vessel size is more difficult (left main, bifurcation, diffuse disease) or stent expansion is more problematic (calcific or fibrotic lesions). Failure after modern DESs is rare, and when this occurs (restenosis, thrombosis), it is important to clarify the mechanism with intracoronary imaging.
The easy and rapid acquisition with automatic quantification and three-dimensional reconstruction of modern OCT systems makes this technique a strong competitor of IVUS, and initial observations suggest that the inability to measure the media-to-media diameter can be compensated for by the automatic lumen detection, leading to similar stent expansion. Head-to-head follow-up trials will detect possible differences in clinical outcome after application of these two imaging techniques. OCT has established itself as the preferred modality to assess apposition and integrity of biodegradable stents, possibly giving it an edge if the application of these prostheses will increase as rapidly as predicted. IVUS has limited value for the identification of vulnerable plaques, but its role may grow now that the shortcomings of VH have been overcome by the combination of IVUS and NIRS. OCT also offers complementary information with assessment of cap thickness, macrophage infiltration and early phases of plaque disruption. Information from intravascular imaging, easily acquired in patients requiring treatment for severe lesions causing ischaemia, may help fine-tuning the aggressiveness of the pharmacological and, possibly, interventional treatment of high-risk lesions and patients.115 As always in times of constrained resources and evidence-based medicine, result of trials will determine the growth in penetration and change in indications of intracoronary imaging. Appropriate operator training, starting with young interventionalists and easiness of use with special emphasis on co-registration are equally important to ensure that the positive results observed in clinical trials and registries conducted by expert operators in dedicated centres are applicable to the majority of interventional centres.
Key messages
Intravascular ultrasound (IVUS) and optical coherence tomography (OCT) are complementary techniques to coronary angiography to guide percutaneous coronary interventions.
IVUS has lower spatial resolution but greater penetration depth and is therefore the preferred modality for assessing the entire vessel wall and its characteristics.
OCT has lower penetration depth, but a 10-fold higher spatial resolution than IVUS, which makes it the most suitable tool for evaluation of intraluminal structures and intimal components.
IVUS and OCT reliably measure multivariable analysis, reference-cross-sectional area and length of the diseased segment and offer qualitative characterisation of plaque composition, which may be facilitated by spectroscopy. Together, these modalities help lesion preparation and stent sizing.
After stenting, IVUS and OCT detect stent underexpansion, malapposition, edge dissection, tissue prolapse or thrombosis and guide stent optimisation to improve clinical outcomes.
You can get CPD/CME credits for Education in Heart
Education in Heart articles are accredited by both the UK Royal College of Physicians (London) and the European Board for Accreditation in Cardiology—you need to answer the accompanying multiple choice questions (MCQs). To access the questions, click on BMJ Learning: Take this module on BMJ Learning from the content box at the top right and bottom left of the online article. For more information please go to: http://heart.bmj.com/misc/education.dtl
RCP credits: Log your activity in your CPD diary online (http://www.rcplondon.ac.uk/members/CPDdiary/index.asp)—pass mark is 80%.
EBAC credits: Print out and retain the BMJ Learning certificate once you have completed the MCQs—pass mark is 60%. EBAC/ EACCME Credits can now be converted to AMA PRA Category 1 CME Credits and are recognised by all National Accreditation Authorities in Europe (http://www.ebac-cme.org/newsite/?hit=men02).
Please note: The MCQs are hosted on BMJ Learning—the best available learning website for medical professionals from the BMJ Group. If prompted, subscribers must sign into Heart with their journal's username and password. All users must also complete a one-time registration on BMJ Learning and subsequently log in (with a BMJ Learning username and password) on every visit.
References
Footnotes
Twitter Follow Alfredo Redondo Diéguez @Alfredo_Redondo
Contributors AG and CDM planned and drafted the first manuscript. AG, IDK, ARD and GL took part in the selection and elaboration of images as well as in table preparation. IV, NP, RK, RDS and CDM revised the text and offered important feedback based on their practical experience in the field. ARD, CDM and RDS edited the final version. All the authors have contributed to and approved this final version.
Competing interests None declared.
Patient consent Obtained.
Provenance and peer review Commissioned; externally peer reviewed.