Article Text

Statistics from Altmetric.com
- cardiac imaging and diagnostics
- cardiac computer tomographic (CT) imaging
- cardiac risk factors and prevention
Learning objectives
Review the history and evidence behind risk prediction scores.
Assess the current evidence base for the use of imaging to guide primary prevention.
Consider the impact of imaging on clinical outcomes.
Introduction
Coronary heart disease is the most common cause of death across the world. The WHO estimates it accounts for nearly a third of all global deaths each year and since 1990, more people have died from cardiovascular disease than any other cause.1 So how can we prevent this inexorable tide of cardiovascular morbidity and mortality?
The concept of primary prevention is rooted in history with the old adage ‘prevention is better than cure’ being attributed to Desiderius Erasmus, the 15th century Dutch philosopher. Prevention of cardiovascular diseases, such as myocardial infarction and stroke, is a major goal of the medical community and is embodied in current international guidelines. Indeed, the use of cardiovascular risk scores to identify individuals at risk is the current standard of care across the world.2–6 The rationale for this practice is to select those individuals at greatest risk to maximise the cost-effectiveness of treatment, without recommending therapy in the entire population. This is especially important given that the majority of cardiovascular events are unheralded, and the prognosis in those suffering myocardial infarctions without preceding symptoms of angina is worse.7 However, there is considerable debate surrounding whether this is something that risk scores can accurately do. In an area of practice that requires significant improvement, this article aims to look at whether cardiovascular imaging can be used to optimise the process of primary prevention.
The birth of risk scores
Although many different risk scores are used throughout the world, the Framingham Score is perhaps the most famous. Inspired by the death of President Roosevelt in 1945 and on the back of a pandemic of the then ‘untreatable’ cardiovascular disease, the USA established the National Heart, Lung and Blood Institute whose primary aim was to conduct an epidemiological study of heart disease.8 The Framingham Heart Study was credited with identifying the importance of blood pressure control in the battle to prevent heart disease. It also popularised the term ‘risk factor’, the articulation of which led to the development of cardiovascular risk scores.9 Armed with the knowledge of risk factors such as systolic hypertension and hyperlipidaemia, studies in a primary prevention setting were conducted and confirmed the therapeutic and prognostic efficacy of treatment.10 For example, in the case of lipid control in asymptomatic hypercholesterolaemic men, the West of Scotland Coronary Prevention Study11 demonstrated pravastatin reduced the rates of coronary heart disease death or non-fatal myocardial infarction. As a result of these effective therapies, interventions were focused on identifying those at risk of adverse cardiovascular events in an attempt to prevent them from occurring in the first place. Although individual risk factors are widely recognised and accepted, the nuance of how much risk is required before a treatment should be initiated has since remained a controversial topic. Over the years, many epidemiological studies have led to the creation of risk scores calibrated to local populations. These scores attempt to quantify the probability of an individual having a cardiovascular event, based on estimations from population studies. In 2010, the National Institute for Health and Care Excellence guidelines suggested that a >30% risk of cardiovascular disease at 10 years warranted treatment with statins, but then subsequently reduced this to >20% and in the most recent iteration it is >10%.2 These cut-offs are therefore somewhat arbitrary and are often based on issues of cost-effectiveness, societal acceptability and population prevalence of disease.
Why are risk scores not enough?
Risk scores inevitably end up treating nearly all patients who are middle aged, given that age is such a dominant predictor of cardiovascular risk. Indeed, some have suggested all individuals over the age of 50 should receive a statin.12 13 Despite widespread and near universal adoption of risk scoring and the substantial associated healthcare resource utilisation and cost, its use is actually empirical. Several studies have questioned the ability of risk scores to predict events highlighting the lack of generalisability in broader populations and that the vast majority of younger patients who present with an event would not have qualified for primary prevention using risk scores.14 15 A recent Cochrane Systematic Review assessed the practice of using risk scores to select individuals for the primary prevention of cardiovascular disease.16 Although the review identified 41 trials incorporating nearly 200 000 participants, these studies had a high risk of bias and were of low quality. The principal finding of the systematic review was that there was little or no effect on cardiovascular event rates when clinicians did or did not use cardiovascular risk scores (5.4% vs 5.3%; relative risk 1.01, 95% CI 0.95 to 1.08).
There is a growing body of evidence that suggests a disconnect between primary care physicians and their willingness to prescribe statins for primary prevention, and a reluctance of patients to adhere to therapy. There is major underprescription in current practice with one large cohort study showing that less than half of over 300 000 individuals deemed ‘eligible’ for prevention were prescribed a statin.17 When asked, primary care physicians cite difficulty interpreting risk assessment tools and their ever changing thresholds for treatment as barriers to the use of statin in the primary prevention of cardiovascular disease. Primary care physicians also expressed fears of excessive healthcare resource utilisation and overmedicalisation of healthy individuals.18 On a patient level, there is considerable difficulty in understanding the concept of risk and probabilities which alongside fear of side effects and conflicting reports in the media often results in resistance to taking statin therapy.19–21
The current approach to primary prevention needs to improve and would benefit from:
An enhanced ability to predict risk more accurately.
Better compliance with lifestyle intervention and medications.
Improved net clinical and cost-effectiveness both for the patient and the society.
Non-invasive imaging and primary prevention
An alternative strategy to applying scores that calculate the probabilistic risk for a disease is to screen for the disease. The use of imaging to guide primary prevention is not novel (table 1). Although various modalities have been tested to a greater or lesser extent, imaging of carotid intimal thickness, coronary artery calcium (CAC) scoring and CT coronary angiography (CTCA) have been studied the most.
Current guideline recommendations on imaging in primary prevention
Imaging to enhance risk prediction
Carotid ultrasound
Autopsy studies from the 1960s first suggested a correlation between carotid and coronary atherosclerosis.22 The Kuopio Ischaemic Heart Disease Risk Factor Study followed a large cohort of Finnish men through the late 1980s scanning more than 1500 carotid arteries by ultrasound. They were the first to show that those with carotid intimal thickening had more than double the chance of going on to having a coronary event.23 Carotid intimal thickness measurements can be made using B-mode ultrasonography of the carotid artery (figure 1). This is a relatively inexpensive and readily portable method of detecting early atherosclerosis and does not require the use of ionising radiation.24 Since the 1980s, multiple studies and meta-analyses have shown that intimal thickness is a strong predictor of future vascular events.24 25

B-mode ultrasonography of the carotid artery. (A) Carotid bifurcation in relation to the jugular vein. (B) Carotid intima-media layer which measures 0.4–0.7 mm depending on age.
In addition to the detection of disease, carotid intimal thickness can be used to track disease progression. Multiple meta-analyses have also reported that statin therapy is associated with a dose-dependent reduction in carotid intimal thickness.26 27 A review by the European Society of Cardiovascular Prevention and Rehabilitation felt that there was sufficient evidence for the use of changes in carotid intimal thickness to be used as a measure of atherosclerotic disease.28 Along with Espeland and colleagues,29 they felt that progression of carotid intimal thickness met criteria of a surrogate for cardiovascular disease endpoints in trials assessing statin therapy.
Cardiac CT
Coronary artery calcification is considered pathognomonic of coronary artery disease and can be detected and quantified on CT of the chest (figure 2). Such scans require minimal breath holding, do not require administration of intravenous contrast and incur less radiation than mammography or low-dose lung scanning.30 As a surrogate for coronary artery disease, CT calcium scoring performs better than carotid ultrasound at risk stratification figure 2.31 32

CT being used to calculate coronary calcium score. (A) Raw image showing flecks of calcification in left anterior descending artery. (B) Software autodetecting calcified plaque and highlighting them in pink. (C) Agatston score calculated by clinician delineating left anterior descending (green) and left circumflex (blue) plaque.
The progression of coronary artery calcification is, however, a more complex topic. Unlike plaque thickness in B-mode ultrasonography, progressive calcification is thought to have a stabilising effect on high-risk plaque. Indeed, studies on the effect of statins on coronary calcium have demonstrated continued progression of calcification which adds to this theory.33 34 We suspect that the ability of CAC scoring to predict risk is due to the associated presence of high-risk (mixed or non-calcific) plaque rather than representing a direct effect of the calcific plaque itself.35 Indeed, when assessed separately, a study of over 3000 participants found that progression of coronary calcium score had little to no effect on future risk prediction.36 There is no doubt, however, in the power of a zero calcium score in asymptomatic individuals which has repeatedly demonstrated positive prognostic outcomes.37 Ultimately, calcium scoring may therefore be seen as a measure of stable calcific plaques and its absence, a marker of the lowest risk. How then do we detect high-risk plaque? Here there is growing interest in the use of CTCA which has been validated in large randomised trials looking at patients with stable coronary disease (figures 3 and 4).38 39
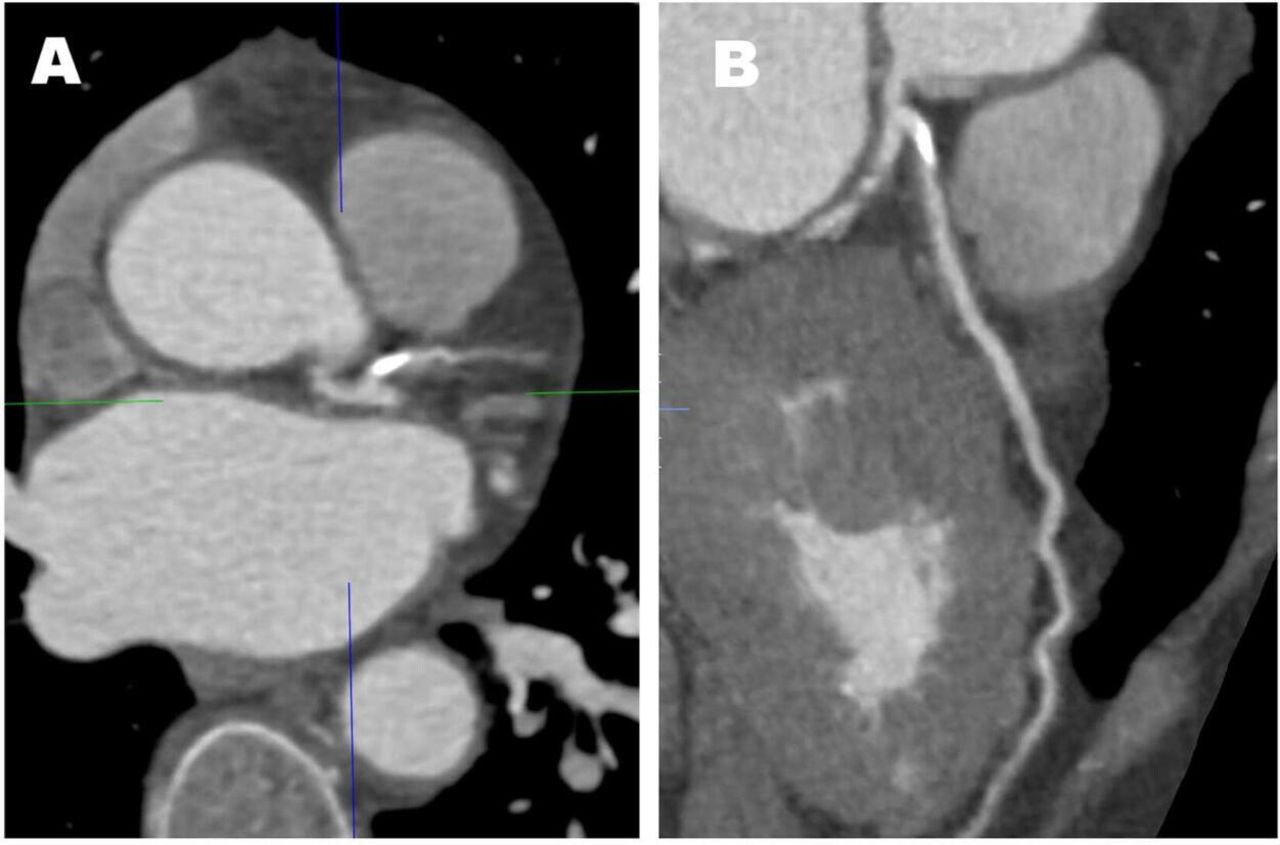
CT coronary angiography of calcific lesion seen in figure 2. (A) Heavy calcification seen in ostial left anterior descending artery. (B) Reconstruction of left anterior descending artery.

Comparison of normal versus abnormal CT coronary angiography. (A) A high-risk, mixed plaque lesion in a diseased left anterior descending artery with severe stenosis at the bifurcation with the first diagonal vessel. (B) Normal right coronary artery.
CT coronary angiography
Although coronary artery calcification is a very good surrogate of coronary heart disease, it does not provide direct information about the total plaque burden or stenosis severity and can be absent in middle-aged patients with non-calcified plaque. CAC scoring is therefore a surrogate of disease rather than truly identifying the presence or absence of coronary heart disease. In this regard, CTCA can be considered the gold standard non-invasive imaging technique that can detect the presence of both calcified and non-calcified coronary heart diseases with a high degree of accuracy. There are several avenues of novel research that are being investigated in this field. For example, a recent study demonstrated how quantification of the low-attenuation (non-calcified) plaque burden was the most powerful predictor of myocardial infarction, outperforming CT coronary calcium scoring, the severity of luminal stenosis and cardiovascular risk factor assessment (figure 5).40

Correlation between plaque burden subtypes, calcium score, coronary stenosis and cardiovascular risk using the Assessing Cardiovascular Risk Using SIGN Guidelines (ASSIGN) score. P<0.001 for all. CACS, Agatston coronary artery calcium score. Reprinted with permission from Williams MC, Kwiecinski J, Mhairi Doris, et al. Low-attenuation noncalcified plaque on coronary computed tomography angiography predicts myocardial infarction. Results from the multicenter SCOT-HEART Trial (Scottish Computed Tomography of the HEART). Circulation. In Press 2020;359.10.1161/CIRCULATIONAHA.119.044720.40
To date, CTCA has not been used systematically to screen for disease in high-risk individuals although there are ongoing prospective longitudinal observational studies, such as the Copenhagen General Population Study and the Swedish Cardiopulmonary Bioimage Study, which will inform on the power of CTCA to predict future risk of cardiovascular events.
Imaging and behavioural change
Carotid ultrasound
Compliance is a particularly difficult issue when it comes to primary prevention. Therapies are indicated in asymptomatic people who, in general, live active and fulfilled lives. Why should they take medication based on the potential of developing disease? Moreover, individuals may experience side effects from treatments that make them feel worse, not better. Imaging has the potential to clarify the concept of risk and provide direct evidence of subclinical disease. Rather than providing a probability of developing disease, patients can visualise coronary or carotid plaque in their own body. This is a significant change in emphasis that can impact on behaviour. For example, in the Visualization of Asymptomatic Atherosclerotic Disease for Optimum Cardiovascular Prevention trial, showing patients pictures of their diseased carotid arteries led to an improvement in their cardiovascular risk scores over 12 months.41 This lends weight to the argument that patients are more likely to make necessary changes to their behaviour when presented with clear evidence of a disease process occurring in their body, rather than with the probability of a diagnosis. The converse is equally true. The cessation of therapies in patients who do not have the disease has the potential to improve their quality of life.42
Cardiac CT
In retrospective cross-sectional studies of asymptomatic patients undergoing calcium scoring, more severe coronary artery calcification is associated with greater lifestyle modifications including medication adherence, dietary modification, weight loss, reduced alcohol intake and increased exercise.43–46 In a meta-analysis, a non-zero CAC score was associated with an increased likelihood of medication initiation and continuation, dietary change (odds ratio 1.8, 95% CI 1.4 to 2.4) and increased exercise (odds ratio 1.9, 95% CI 1.5 to 2.5).47 The Early Identification of Subclinical Atherosclerosis by Noninvasive Imaging Research (EISNER) trial randomised 2137 participants to risk factor management with and without screening with a calcium score.48 The knowledge of the calcium score was associated with better risk factor management with lower blood pressures, cholesterol concentrations and abdominal girth.49 Indeed, the higher the calcium score, the greater the improvements that were seen, underlining the impact of imaging on physician and patient behaviour. Another small randomised trial demonstrated how showing patients their coronary artery calcification was associated with favourable changes in lifestyle such as increased medication compliance, improved lipid profile and reduced smoking.50
CT coronary angiography
There are currently no studies that have assessed the impact of CTCA on behaviour modification. However, studies are ongoing to address this issue (NCT04156061) with the aim of determining the effects on lifestyle, medication compliance and risk factor modification of CTCA compared with standard risk score assessments. This study will also investigate whether showing individuals the images of their coronaries has a greater impact on their compliance and behaviour than provision of a verbal report.
Imaging and clinical outcomes
Carotid ultrasound
The true impact of imaging on hard clinical outcomes and cost-effectiveness requires randomised controlled trials. However, in the absence of such data, observational studies can provide some limited information. Van den Oord and colleagues conducted a meta-analysis of more than 32 000 patients demonstrating that the c-statistic or an area under the curve analysis for traditional risk factors was 0.726, and that the addition of carotid intima-media thickness did not provide a meaningful increase in this risk prediction (0.729, p=0.8).51 This was further highlighted in a comparative study conducted by Kavousi and colleagues who calculated the net reclassification index (a measure of how well a new model reclassifies patients) using a variety of ‘new markers’ for coronary risk prediction including carotid intimal thickness.52 They found only a marginal improvement when using carotid ultrasound (reclassifies only 1.6% of the population). The reasons for carotid imaging’s relatively poor performance may lie in the lack of a uniform methodology. In addition, carotid atherosclerosis is remote from the major cause of cardiovascular events, coronary artery disease. Correlation of carotid intimal thickening with the presence of coronary artery disease is modest and unreliable.53 This may be improved by the more comprehensive assessments of carotid plaque burden which can have comparable results to coronary calcium scoring.24 54
Cardiac CT
To date, there have been three prospective trials that have attempted to evaluate the clinical and cost outcomes of CAC scoring in an asymptomatic population (table 2). The Prospective Army Coronary Calcium study (n=1640) aimed to assess the impact of calcium scoring on the management of cardiovascular risk factors.55 Although it demonstrated the ability of calcium scanning to shift clinicians’ management of patients, this did not translate into a reduction in risk or cardiovascular events. Within this very low-risk and young population (mean age 42 years), 85% of participants had a calcium score of zero in the scanning arm which undoubtedly limited its ability to assess improvements in cardiovascular outcomes.49 This again emphasises the importance of targeting risk scores or imaging to populations with a significant prevalence of the disease. From a health economics perspective, the EISNER trial showed that the use of calcium scoring did not add to downstream medical testing or reduce costs.48
Imaging trials on cardiovascular disease prevention
The St Francis Heart (n=1005) study was a double-blinded randomised controlled trial where participants with a mean calcium score of ≥500 were given a combination of atorvastatin 20 mg, vitamins C and E or matched placebo.56 The primary outcome was to assess whether aggressive control of lipid risk factors could slow the progression of coronary calcification and thereby reduce cardiovascular events. The investigators found that coronary calcification continued to progress although the rates of cardiovascular event did appear to improve after 5 years (p=0.08).49 This study was perhaps underpowered but also again raises the question about the use of coronary calcium scores to assess disease progression and response to therapy. Given the low number of events in a primary prevention population, large-scale long-term randomised trials are needed, such as the ongoing Risk or Benefit in Screening for Cardiovascular Diseases (ROBINSCA) trial.57
CT coronary angiography
The FACTOR-64 trial has been the only CTCA trial in primary prevention, and it specifically recruited 900 patients with type 1 or 2 diabetes mellitus only.58 Participants found to have coronary heart disease on CTCA were targeted for more intensive risk factor modification, although 75% of trial participants were already on a statin at baseline. Compared with standard of care, those assigned to CTCA had a low-density lipoprotein-cholesterol concentration that was 0.06 mmol/L lower (p=0.02) but there was no difference in blood pressure or haemoglobin A1c concentrations. In the intention-to-treat analysis, the primary endpoint occurred in 6.2% of the CTCA group compared with 7.6% in the control group (HR 0.80, 95% CI 0.49 to 1.32; p=0.38). In the as-treated analysis, the respective event rates were 5.6% vs 7.9% (HR 0.69, 95% CI 0.41 to 1.16; p=0.16). The failure to demonstrate a benefit is therefore likely to represent the inability to deliver a major difference in treatment and management consequent on the application of the imaging test, and a lack of power due to the small sample size and lower than anticipated event rate.
Although not performed on an asymptomatic population, the Scottish Computed Tomography of the HEART (SCOT-HEART) trial raised several interesting observations.42 59 First, the reduction in coronary events was independent of symptoms. Indeed, the point estimates suggested that patients with non-anginal chest pain showed at least as much benefit from CTCA (hazard ratio [HR] 0.45, 95% CI 0.19 to 1.03) as those with possible angina (HR 0.60, 95% CI 0.37 to 0.96) and those with known coronary heart disease (HR 0.65, 95% CI 0.32 to 1.32). Second, a large proportion (40%–50%) of patients were on antiplatelet or statin therapy at baseline42 and, after 5 years of follow-up, the overall rates of prescription of these drugs varied by ~10%.59 Indeed, the relative reduction in coronary events was similar whether participants were taking statin therapy at baseline (HR 0.57, 95% CI 0.34 to 0.95) or not (HR 0.57, 95% CI 0.28 to 1.15). However, CTCA-guided management markedly increased statin use in those with non-anginal chest who had coronary artery disease on the CT scan irrespective of the risk score (figure 6).60 The overall rates of change in statin therapy therefore encompass both cessation and initiation of therapy, suggesting that CTCA is a better guide for patient management. Third, the risk score was a poor predictor of coronary artery disease. The average score (10-year cardiovascular risk) was 13 (range 1–59) in patients with normal coronary arteries, and 23 (range 2–62) in those with obstructive coronary artery disease. Indeed, in those undergoing CTCA, 39% of patients were misclassified using a score of 20, and 33% were misclassified using a score of 10. Finally, the prevention of myocardial infarction requires the targeting of non-obstructive coronary artery disease as 50%–65% of patients who suffered a subsequent myocardial infarction had non-obstructive disease on CTCA at baseline.39 59 Thus, the relative and absolute reductions in coronary events were the same irrespective of symptoms, independent of baseline statin use or cardiovascular risk score and driven by both non-obstructive and obstructive coronary artery diseases.

Interaction between CT coronary angiography findings and clinically estimated cardiovascular risk in relation to prescribing of preventive therapy. Frequency of prescribing for (A) antiplatelet and (B) statin therapy at 6 weeks in people with obstructive (red), non-obstructive (yellow) and normal coronary arteries (green) on CT coronary angiography across a range of 10-year cardiovascular risk determined using the Assessing Cardiovascular Risk Using SIGN Guidelines (ASSIGN) score. Reprinted with permission from Adamson et al.60
These observations form the basis for the CTCA for the prevention of myocardial infarction (SCOT-HEART 2) trial which aims to recruit 6000 asymptomatic individuals and will randomise them to a management strategy guided by either CTCA or a cardiovascular risk score (NCT03920176) (table 3). This will provide the evidence of whether such an imaging strategy has utility in contemporary practice.
Ongoing trials on CT in cardiovascular disease prevention
Conclusion
Prevention of cardiovascular disease is currently guided by probabilistic risk scores that both overtreat and undertreat individuals, commit most middle-aged people to pharmacotherapy and have little evidence base. Fundamentally, imaging in asymptomatic people can prevent overmedicalisation of the truly healthy and promote treatment and risk factor modification in those with subclinical disease. The evidence for improved acceptance of preventive therapies and lifestyle interventions is growing, but we still require evidence of improved clinical outcomes. Although it is right that we should put these investigations through rigorous trials, we have had the capacity to screen for coronary artery disease for over 20 years. Only now are we beginning to explore what technology and innovation can do to give preventive cardiology its big breakthrough, long-awaited since the death of President Roosevelt.
Key messages
In asymptomatic people:
Primary prevention of cardiovascular disease is currently guided by probabilistic risk scores that have never been prospectively validated.
Imaging techniques enhance the ability to predict risk over and above risk scores.
Imaging techniques improve compliance with medication and promote uptake of positive lifestyle choices.
Imaging has the potential to improve clinical outcomes by focusing treatments on patients who actually have the disease while simultaneously stopping treatments in those who do not require them.
CME credits for Education in Heart
Education in Heart articles are accredited for CME by various providers. To answer the accompanying multiple choice questions (MCQs) and obtain your credits, click on the ‘Take the Test’ link on the online version of the article. The MCQs are hosted on BMJ Learning. All users must complete a one-time registration on BMJ Learning and subsequently log in on every visit using their username and password to access modules and their CME record. Accreditation is only valid for 2 years from the date of publication. Printable CME certificates are available to users that achieve the minimum pass mark.
Footnotes
Twitter @MarcDweck
Contributors MNM wrote the first draft of the article. All authors contributed to the revision and writing of the article.
Funding The authors are supported by the British Heart Foundation (FS/19/46/34445, FS/14/78/31020, CH/09/002, RG/16/10/32375, RE/18/5/34216, CS/18/4/34074). DEN is the recipient of a Wellcome Trust Senior Investigator Award (WT103782AIA). MRD is supported by a Sir Jules Thorn Award for Biomedical Research 2015.
Competing interests None declared.
Patient and public involvement Patients and/or the public were involved in the design, or conduct, or reporting, or dissemination plans of this manuscript.
Patient consent for publication Not required.
Provenance and peer review Commissioned; internally peer reviewed.
Author note References which include a * are considered to be key references